matplotlib.pyplot.axes(*args, **kwargs)¶Add an axes to the figure.
The axes is added at position rect specified by:
axes() by itself creates a default full subplot(111) window axis.axes(rect, facecolor='w') where rect = [left, bottom, width,
height] in normalized (0, 1) units. facecolor is the background
color for the axis, default white.axes(h) where h is an axes instance makes h the current
axis and the parent of h the current figure.
An Axes instance is returned.| kwarg | Accepts | Description |
|---|---|---|
| facecolor | color | the axes background color |
| frameon | [True|False] | display the frame? |
| sharex | otherax | current axes shares xaxis attribute with otherax |
| sharey | otherax | current axes shares yaxis attribute with otherax |
| polar | [True|False] | use a polar axes? |
| aspect | [str | num] | [‘equal’, ‘auto’] or a number. If a number
the ratio of x-unit/y-unit in screen-space.
Also see
set_aspect(). |
Examples:
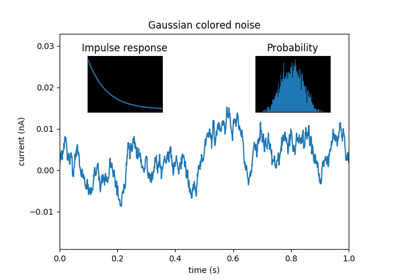
examples/pylab_examples/axes_demo.py places custom axes.examples/pylab_examples/shared_axis_demo.py uses
sharex and sharey.