

(Source code, png, pdf)
"""
======================
Inches and Centimeters
======================
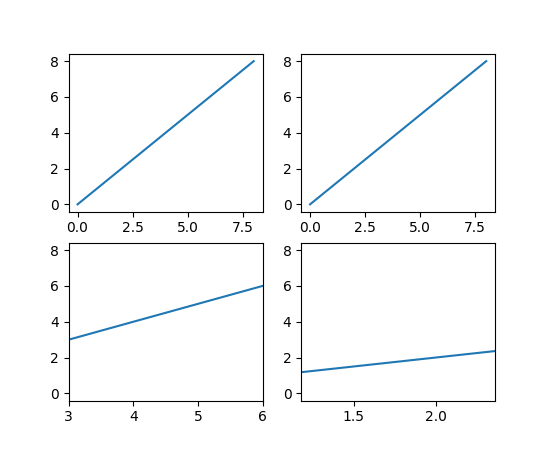
The example illustrates the ability to override default x and y units (ax1) to
inches and centimeters using the `xunits` and `yunits` parameters for the
`plot` function. Note that conversions are applied to get numbers to correct
units.
"""
from basic_units import cm, inch
import matplotlib.pyplot as plt
import numpy
cms = cm * numpy.arange(0, 10, 2)
fig = plt.figure()
ax1 = fig.add_subplot(2, 2, 1)
ax1.plot(cms, cms)
ax2 = fig.add_subplot(2, 2, 2)
ax2.plot(cms, cms, xunits=cm, yunits=inch)
ax3 = fig.add_subplot(2, 2, 3)
ax3.plot(cms, cms, xunits=inch, yunits=cm)
ax3.set_xlim(3, 6) # scalars are interpreted in current units
ax4 = fig.add_subplot(2, 2, 4)
ax4.plot(cms, cms, xunits=inch, yunits=inch)
ax4.set_xlim(3*cm, 6*cm) # cm are converted to inches
plt.show()
Keywords: python, matplotlib, pylab, example, codex (see Search examples)