

(Source code, png, pdf)
"""
=======================================================
Controlling style of text and labels using a dictionary
=======================================================
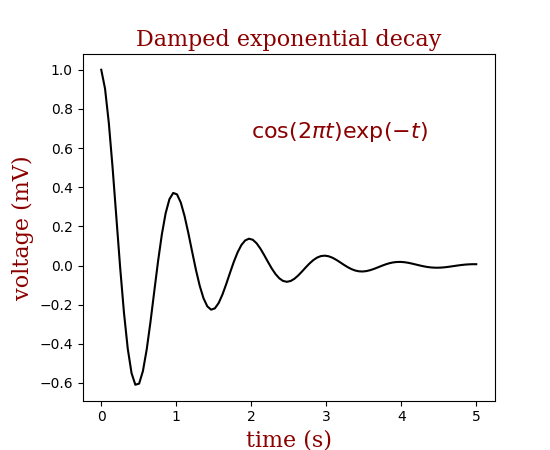
This example shows how to share parameters across many text objects and labels
by creating a dictionary of options passed across several functions.
"""
import numpy as np
import matplotlib.pyplot as plt
font = {'family': 'serif',
'color': 'darkred',
'weight': 'normal',
'size': 16,
}
x = np.linspace(0.0, 5.0, 100)
y = np.cos(2*np.pi*x) * np.exp(-x)
plt.plot(x, y, 'k')
plt.title('Damped exponential decay', fontdict=font)
plt.text(2, 0.65, r'$\cos(2 \pi t) \exp(-t)$', fontdict=font)
plt.xlabel('time (s)', fontdict=font)
plt.ylabel('voltage (mV)', fontdict=font)
# Tweak spacing to prevent clipping of ylabel
plt.subplots_adjust(left=0.15)
plt.show()
Keywords: python, matplotlib, pylab, example, codex (see Search examples)