

(Source code, png, pdf)

"""
=============================
Demo of the errorbar function
=============================
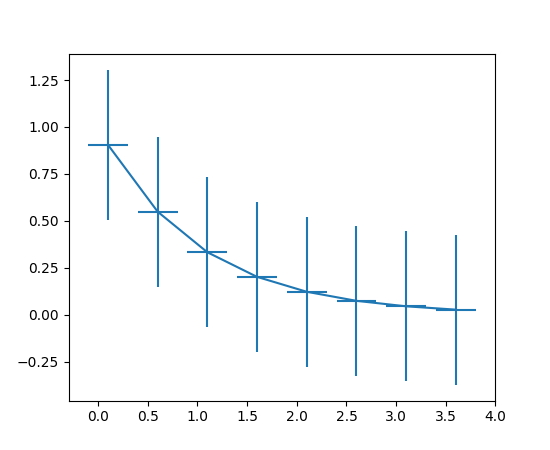
This exhibits the most basic use of the error bar method.
In this case, constant values are provided for the error
in both the x- and y-directions.
"""
import numpy as np
import matplotlib.pyplot as plt
# example data
x = np.arange(0.1, 4, 0.5)
y = np.exp(-x)
fig, ax = plt.subplots()
ax.errorbar(x, y, xerr=0.2, yerr=0.4)
plt.show()
Keywords: python, matplotlib, pylab, example, codex (see Search examples)