

(Source code, png, pdf)
"""
=================================
Box plots with custom fill colors
=================================
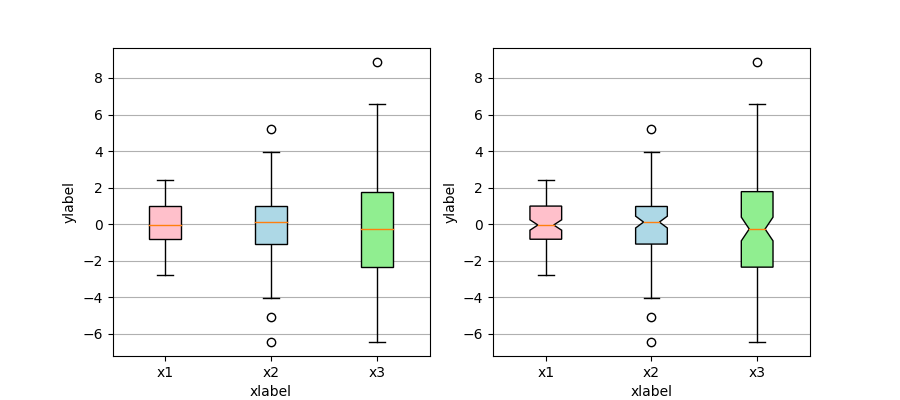
This plot illustrates how to create two types of box plots
(rectangular and notched), and how to fill them with custom
colors by accessing the properties of the artists of the
box plots. Additionally, the ``labels`` parameter is used to
provide x-tick labels for each sample.
A good general reference on boxplots and their history can be found
here: http://vita.had.co.nz/papers/boxplots.pdf
"""
import matplotlib.pyplot as plt
import numpy as np
# Random test data
np.random.seed(123)
all_data = [np.random.normal(0, std, 100) for std in range(1, 4)]
fig, axes = plt.subplots(nrows=1, ncols=2, figsize=(9, 4))
# rectangular box plot
bplot1 = axes[0].boxplot(all_data,
vert=True, # vertical box aligmnent
patch_artist=True) # fill with color
# notch shape box plot
bplot2 = axes[1].boxplot(all_data,
notch=True, # notch shape
vert=True, # vertical box aligmnent
patch_artist=True) # fill with color
# fill with colors
colors = ['pink', 'lightblue', 'lightgreen']
for bplot in (bplot1, bplot2):
for patch, color in zip(bplot['boxes'], colors):
patch.set_facecolor(color)
# adding horizontal grid lines
for ax in axes:
ax.yaxis.grid(True)
ax.set_xticks([y+1 for y in range(len(all_data))], )
ax.set_xlabel('xlabel')
ax.set_ylabel('ylabel')
# add x-tick labels
plt.setp(axes, xticks=[y+1 for y in range(len(all_data))],
xticklabels=['x1', 'x2', 'x3', 'x4'])
plt.show()
Keywords: python, matplotlib, pylab, example, codex (see Search examples)