

(Source code, png, pdf)
"""
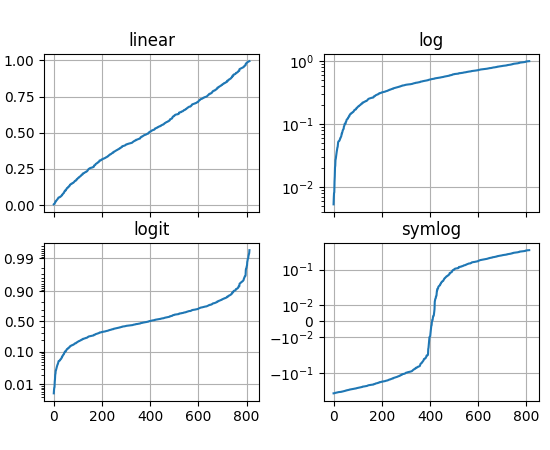
Illustrate the scale transformations applied to axes, e.g. log, symlog, logit.
"""
import numpy as np
import matplotlib.pyplot as plt
from matplotlib.ticker import NullFormatter
np.random.seed(1)
# make up some data in the interval ]0, 1[
y = np.random.normal(loc=0.5, scale=0.4, size=1000)
y = y[(y > 0) & (y < 1)]
y.sort()
x = np.arange(len(y))
# plot with various axes scales
fig, axs = plt.subplots(2, 2, sharex=True)
fig.subplots_adjust(left=0.08, right=0.98, wspace=0.3)
# linear
ax = axs[0, 0]
ax.plot(x, y)
ax.set_yscale('linear')
ax.set_title('linear')
ax.grid(True)
# log
ax = axs[0, 1]
ax.plot(x, y)
ax.set_yscale('log')
ax.set_title('log')
ax.grid(True)
# symmetric log
ax = axs[1, 1]
ax.plot(x, y - y.mean())
ax.set_yscale('symlog', linthreshy=0.02)
ax.set_title('symlog')
ax.grid(True)
# logit
ax = axs[1, 0]
ax.plot(x, y)
ax.set_yscale('logit')
ax.set_title('logit')
ax.grid(True)
ax.yaxis.set_minor_formatter(NullFormatter())
plt.show()
Keywords: python, matplotlib, pylab, example, codex (see Search examples)