

(Source code, png, pdf)

"""
Controlling the properties of axis text using handles
See examples/text_themes.py for a more elegant, pythonic way to control
fonts. After all, if we were slaves to MATLAB , we wouldn't be
using python!
"""
import matplotlib.pyplot as plt
import numpy as np
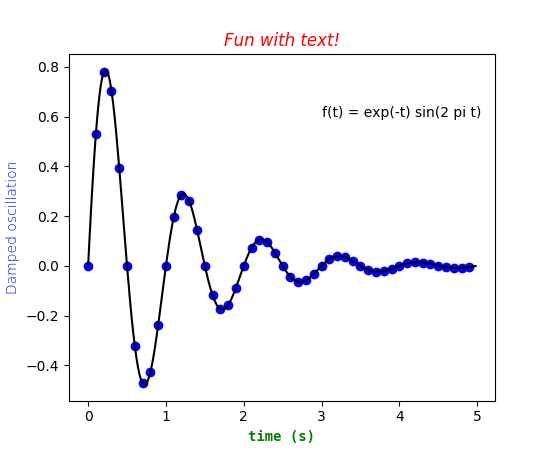
def f(t):
s1 = np.sin(2*np.pi*t)
e1 = np.exp(-t)
return np.multiply(s1, e1)
t1 = np.arange(0.0, 5.0, 0.1)
t2 = np.arange(0.0, 5.0, 0.02)
fig, ax = plt.subplots()
plt.plot(t1, f(t1), 'bo', t2, f(t2), 'k')
plt.text(3.0, 0.6, 'f(t) = exp(-t) sin(2 pi t)')
ttext = plt.title('Fun with text!')
ytext = plt.ylabel('Damped oscillation')
xtext = plt.xlabel('time (s)')
plt.setp(ttext, size='large', color='r', style='italic')
plt.setp(xtext, size='medium', name=['Courier', 'DejaVu Sans Mono'],
weight='bold', color='g')
plt.setp(ytext, size='medium', name=['Helvetica', 'DejaVu Sans'],
weight='light', color='b')
plt.show()
Keywords: python, matplotlib, pylab, example, codex (see Search examples)