

(Source code, png, pdf)
'''
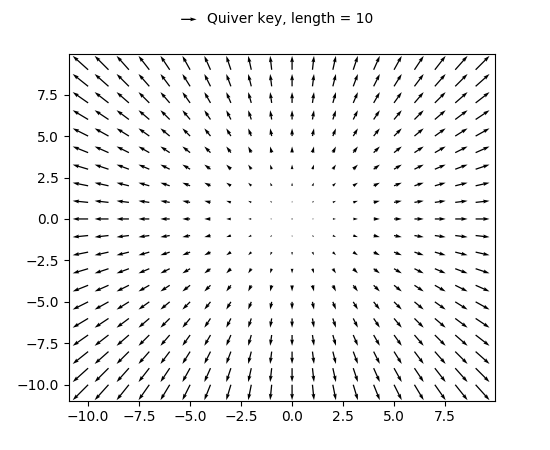
==================================================
A simple example of a quiver plot with a quiverkey
==================================================
'''
import matplotlib.pyplot as plt
import numpy as np
X = np.arange(-10, 10, 1)
Y = np.arange(-10, 10, 1)
U, V = np.meshgrid(X, Y)
fig, ax = plt.subplots()
q = ax.quiver(X, Y, U, V)
ax.quiverkey(q, X=0.3, Y=1.1, U=10,
label='Quiver key, length = 10', labelpos='E')
plt.show()
Keywords: python, matplotlib, pylab, example, codex (see Search examples)