

import matplotlib.pyplot as plt
import numpy as np
import matplotlib.cbook as cbook
fname = cbook.get_sample_data('msft.csv', asfileobj=False)
fname2 = cbook.get_sample_data('data_x_x2_x3.csv', asfileobj=False)
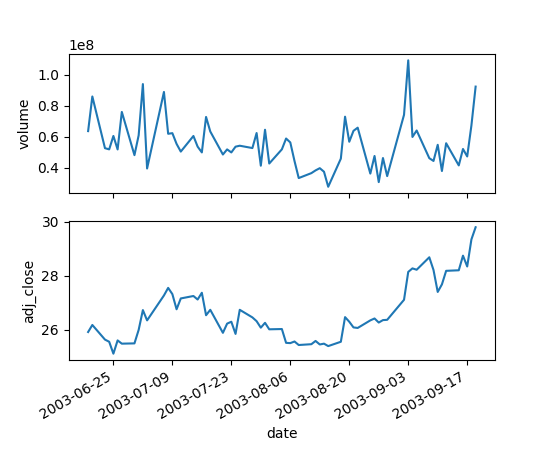
# test 1; use ints
plt.plotfile(fname, (0, 5, 6))
# test 2; use names
plt.plotfile(fname, ('date', 'volume', 'adj_close'))
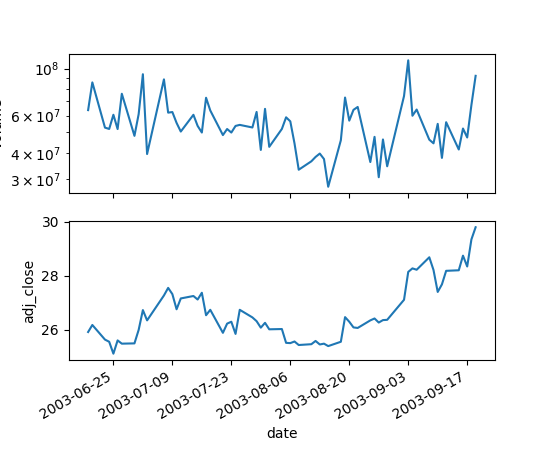
# test 3; use semilogy for volume
plt.plotfile(fname, ('date', 'volume', 'adj_close'),
plotfuncs={'volume': 'semilogy'})
# test 4; use semilogy for volume
plt.plotfile(fname, (0, 5, 6), plotfuncs={5: 'semilogy'})
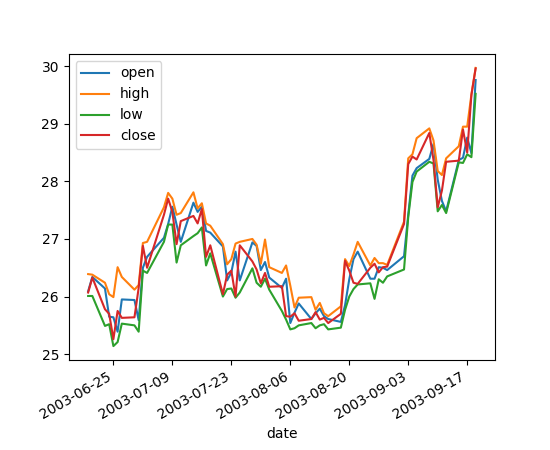
# test 5; single subplot
plt.plotfile(fname, ('date', 'open', 'high', 'low', 'close'), subplots=False)
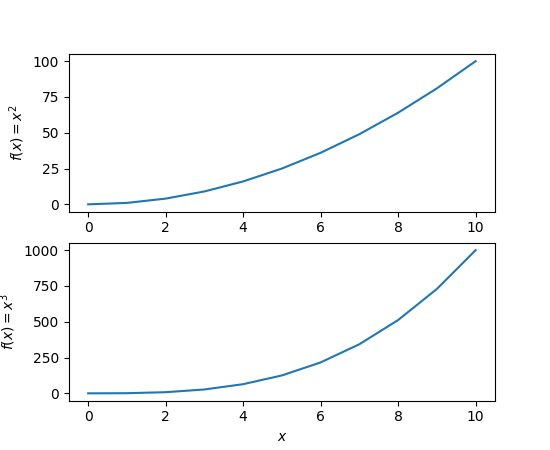
# test 6; labeling, if no names in csv-file
plt.plotfile(fname2, cols=(0, 1, 2), delimiter=' ',
names=['$x$', '$f(x)=x^2$', '$f(x)=x^3$'])
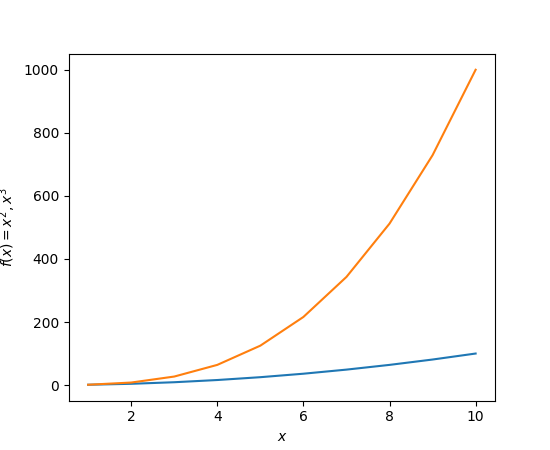
# test 7; more than one file per figure--illustrated here with a single file
plt.plotfile(fname2, cols=(0, 1), delimiter=' ')
plt.plotfile(fname2, cols=(0, 2), newfig=False,
delimiter=' ') # use current figure
plt.xlabel(r'$x$')
plt.ylabel(r'$f(x) = x^2, x^3$')
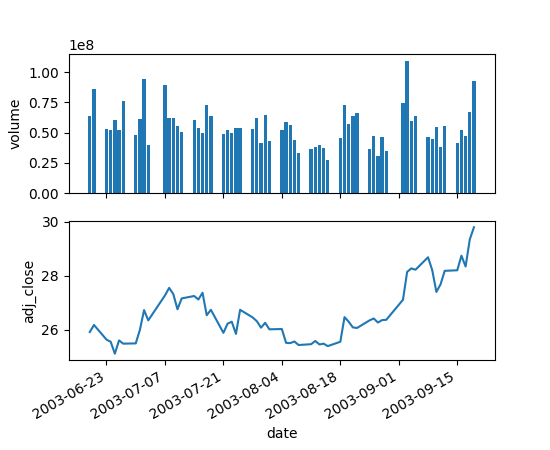
# test 8; use bar for volume
plt.plotfile(fname, (0, 5, 6), plotfuncs={5: 'bar'})
plt.show()
Keywords: python, matplotlib, pylab, example, codex (see Search examples)


