

(Source code, png, pdf)

# use masked arrays to plot a line with different colors by y-value
import numpy as np
import matplotlib.pyplot as plt
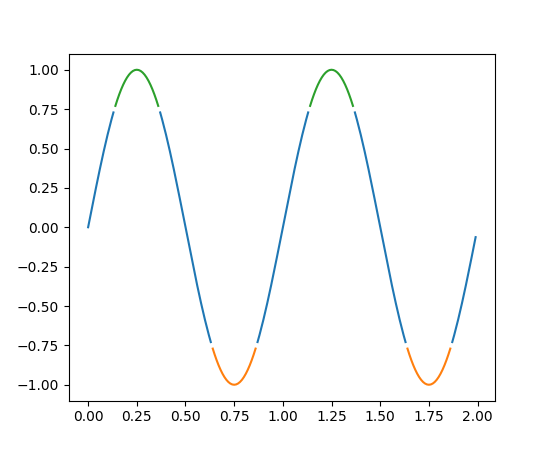
t = np.arange(0.0, 2.0, 0.01)
s = np.sin(2*np.pi*t)
upper = 0.77
lower = -0.77
supper = np.ma.masked_where(s < upper, s)
slower = np.ma.masked_where(s > lower, s)
smiddle = np.ma.masked_where(np.logical_or(s < lower, s > upper), s)
plt.plot(t, smiddle, t, slower, t, supper)
plt.show()
Keywords: python, matplotlib, pylab, example, codex (see Search examples)