

(Source code, png, pdf)
"""
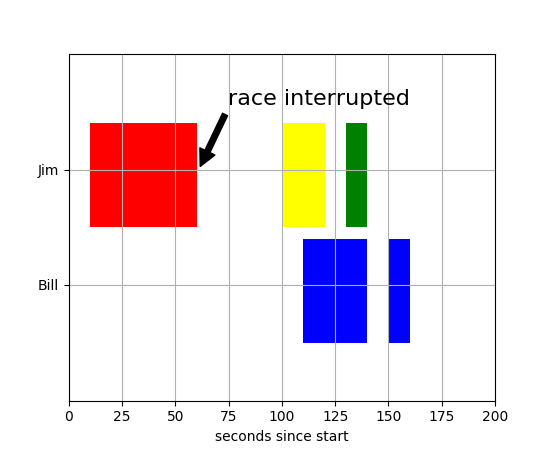
Make a "broken" horizontal bar plot, i.e., one with gaps
"""
import matplotlib.pyplot as plt
fig, ax = plt.subplots()
ax.broken_barh([(110, 30), (150, 10)], (10, 9), facecolors='blue')
ax.broken_barh([(10, 50), (100, 20), (130, 10)], (20, 9),
facecolors=('red', 'yellow', 'green'))
ax.set_ylim(5, 35)
ax.set_xlim(0, 200)
ax.set_xlabel('seconds since start')
ax.set_yticks([15, 25])
ax.set_yticklabels(['Bill', 'Jim'])
ax.grid(True)
ax.annotate('race interrupted', (61, 25),
xytext=(0.8, 0.9), textcoords='axes fraction',
arrowprops=dict(facecolor='black', shrink=0.05),
fontsize=16,
horizontalalignment='right', verticalalignment='top')
plt.show()
Keywords: python, matplotlib, pylab, example, codex (see Search examples)