

(Source code, png, pdf)
from matplotlib.patches import Rectangle, Ellipse
from matplotlib.offsetbox import AnchoredOffsetbox, AuxTransformBox, VPacker,\
TextArea, DrawingArea
class AnchoredText(AnchoredOffsetbox):
def __init__(self, s, loc, pad=0.4, borderpad=0.5, prop=None, frameon=True):
self.txt = TextArea(s,
minimumdescent=False)
super(AnchoredText, self).__init__(loc, pad=pad, borderpad=borderpad,
child=self.txt,
prop=prop,
frameon=frameon)
class AnchoredSizeBar(AnchoredOffsetbox):
def __init__(self, transform, size, label, loc,
pad=0.1, borderpad=0.1, sep=2, prop=None, frameon=True):
"""
Draw a horizontal bar with the size in data coordinate of the give axes.
A label will be drawn underneath (center-aligned).
pad, borderpad in fraction of the legend font size (or prop)
sep in points.
"""
self.size_bar = AuxTransformBox(transform)
self.size_bar.add_artist(Rectangle((0, 0), size, 0, fc="none", lw=1.0))
self.txt_label = TextArea(label, minimumdescent=False)
self._box = VPacker(children=[self.size_bar, self.txt_label],
align="center",
pad=0, sep=sep)
AnchoredOffsetbox.__init__(self, loc, pad=pad, borderpad=borderpad,
child=self._box,
prop=prop,
frameon=frameon)
class AnchoredEllipse(AnchoredOffsetbox):
def __init__(self, transform, width, height, angle, loc,
pad=0.1, borderpad=0.1, prop=None, frameon=True):
"""
Draw an ellipse the size in data coordinate of the give axes.
pad, borderpad in fraction of the legend font size (or prop)
"""
self._box = AuxTransformBox(transform)
self.ellipse = Ellipse((0, 0), width, height, angle)
self._box.add_artist(self.ellipse)
AnchoredOffsetbox.__init__(self, loc, pad=pad, borderpad=borderpad,
child=self._box,
prop=prop,
frameon=frameon)
class AnchoredDrawingArea(AnchoredOffsetbox):
def __init__(self, width, height, xdescent, ydescent,
loc, pad=0.4, borderpad=0.5, prop=None, frameon=True):
self.da = DrawingArea(width, height, xdescent, ydescent)
super(AnchoredDrawingArea, self).__init__(loc, pad=pad, borderpad=borderpad,
child=self.da,
prop=None,
frameon=frameon)
if __name__ == "__main__":
import matplotlib.pyplot as plt
ax = plt.gca()
ax.set_aspect(1.)
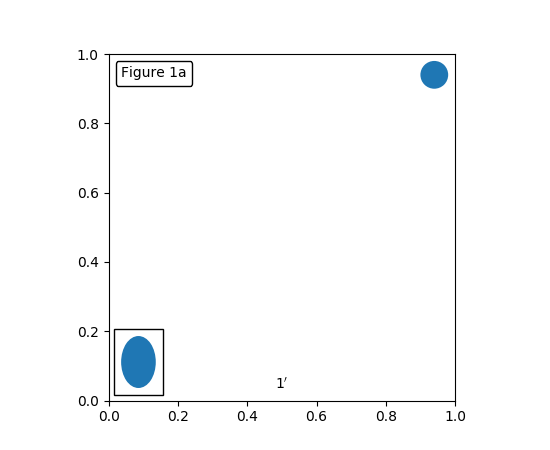
at = AnchoredText("Figure 1a",
loc=2, frameon=True)
at.patch.set_boxstyle("round,pad=0.,rounding_size=0.2")
ax.add_artist(at)
from matplotlib.patches import Circle
ada = AnchoredDrawingArea(20, 20, 0, 0,
loc=1, pad=0., frameon=False)
p = Circle((10, 10), 10)
ada.da.add_artist(p)
ax.add_artist(ada)
# draw an ellipse of width=0.1, height=0.15 in the data coordinate
ae = AnchoredEllipse(ax.transData, width=0.1, height=0.15, angle=0.,
loc=3, pad=0.5, borderpad=0.4, frameon=True)
ax.add_artist(ae)
# draw a horizontal bar with length of 0.1 in Data coordinate
# (ax.transData) with a label underneath.
asb = AnchoredSizeBar(ax.transData,
0.1,
r"1$^{\prime}$",
loc=8,
pad=0.1, borderpad=0.5, sep=5,
frameon=False)
ax.add_artist(asb)
plt.draw()
plt.show()
Keywords: python, matplotlib, pylab, example, codex (see Search examples)