

(Source code, png, pdf)
'''
=================
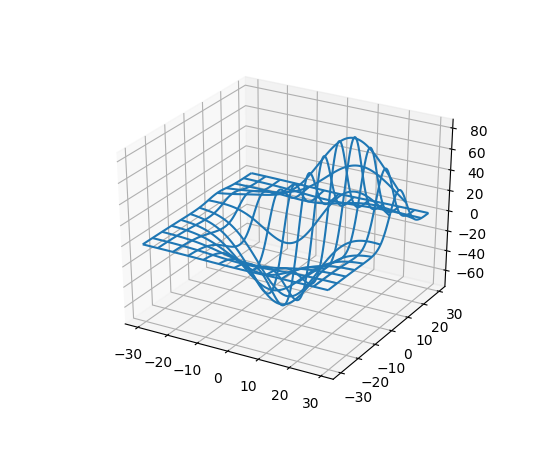
3D wireframe plot
=================
A very basic demonstration of a wireframe plot.
'''
from mpl_toolkits.mplot3d import axes3d
import matplotlib.pyplot as plt
fig = plt.figure()
ax = fig.add_subplot(111, projection='3d')
# Grab some test data.
X, Y, Z = axes3d.get_test_data(0.05)
# Plot a basic wireframe.
ax.plot_wireframe(X, Y, Z, rstride=10, cstride=10)
plt.show()
Keywords: python, matplotlib, pylab, example, codex (see Search examples)