

(Source code, png, pdf)

'''
=========================
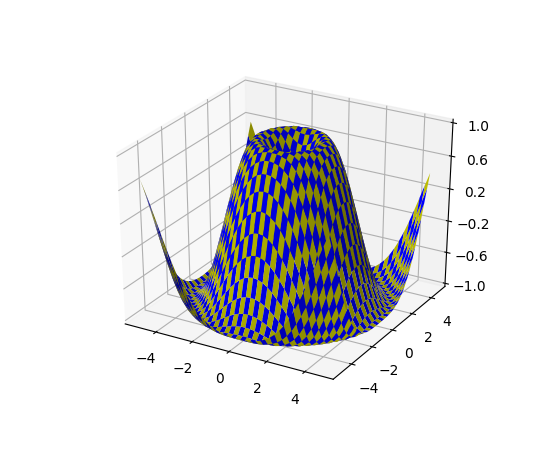
3D surface (checkerboard)
=========================
Demonstrates plotting a 3D surface colored in a checkerboard pattern.
'''
from mpl_toolkits.mplot3d import Axes3D
import matplotlib.pyplot as plt
from matplotlib import cm
from matplotlib.ticker import LinearLocator
import numpy as np
fig = plt.figure()
ax = fig.gca(projection='3d')
# Make data.
X = np.arange(-5, 5, 0.25)
xlen = len(X)
Y = np.arange(-5, 5, 0.25)
ylen = len(Y)
X, Y = np.meshgrid(X, Y)
R = np.sqrt(X**2 + Y**2)
Z = np.sin(R)
# Create an empty array of strings with the same shape as the meshgrid, and
# populate it with two colors in a checkerboard pattern.
colortuple = ('y', 'b')
colors = np.empty(X.shape, dtype=str)
for y in range(ylen):
for x in range(xlen):
colors[x, y] = colortuple[(x + y) % len(colortuple)]
# Plot the surface with face colors taken from the array we made.
surf = ax.plot_surface(X, Y, Z, facecolors=colors, linewidth=0)
# Customize the z axis.
ax.set_zlim(-1, 1)
ax.w_zaxis.set_major_locator(LinearLocator(6))
plt.show()
Keywords: python, matplotlib, pylab, example, codex (see Search examples)