

(Source code, png, pdf)
'''
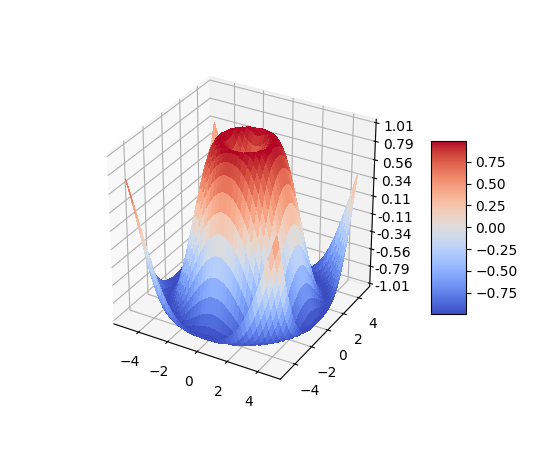
======================
3D surface (color map)
======================
Demonstrates plotting a 3D surface colored with the coolwarm color map.
The surface is made opaque by using antialiased=False.
Also demonstrates using the LinearLocator and custom formatting for the
z axis tick labels.
'''
from mpl_toolkits.mplot3d import Axes3D
import matplotlib.pyplot as plt
from matplotlib import cm
from matplotlib.ticker import LinearLocator, FormatStrFormatter
import numpy as np
fig = plt.figure()
ax = fig.gca(projection='3d')
# Make data.
X = np.arange(-5, 5, 0.25)
Y = np.arange(-5, 5, 0.25)
X, Y = np.meshgrid(X, Y)
R = np.sqrt(X**2 + Y**2)
Z = np.sin(R)
# Plot the surface.
surf = ax.plot_surface(X, Y, Z, cmap=cm.coolwarm,
linewidth=0, antialiased=False)
# Customize the z axis.
ax.set_zlim(-1.01, 1.01)
ax.zaxis.set_major_locator(LinearLocator(10))
ax.zaxis.set_major_formatter(FormatStrFormatter('%.02f'))
# Add a color bar which maps values to colors.
fig.colorbar(surf, shrink=0.5, aspect=5)
plt.show()
Keywords: python, matplotlib, pylab, example, codex (see Search examples)