

(Source code, png, pdf)
'''
==============
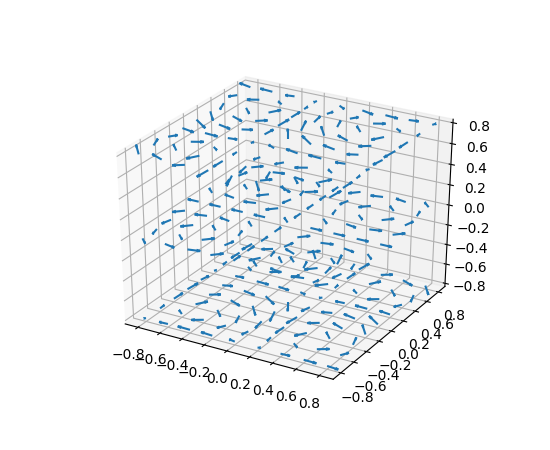
3D quiver plot
==============
Demonstrates plotting directional arrows at points on a 3d meshgrid.
'''
from mpl_toolkits.mplot3d import axes3d
import matplotlib.pyplot as plt
import numpy as np
fig = plt.figure()
ax = fig.gca(projection='3d')
# Make the grid
x, y, z = np.meshgrid(np.arange(-0.8, 1, 0.2),
np.arange(-0.8, 1, 0.2),
np.arange(-0.8, 1, 0.8))
# Make the direction data for the arrows
u = np.sin(np.pi * x) * np.cos(np.pi * y) * np.cos(np.pi * z)
v = -np.cos(np.pi * x) * np.sin(np.pi * y) * np.cos(np.pi * z)
w = (np.sqrt(2.0 / 3.0) * np.cos(np.pi * x) * np.cos(np.pi * y) *
np.sin(np.pi * z))
ax.quiver(x, y, z, u, v, w, length=0.1, normalize=True)
plt.show()
Keywords: python, matplotlib, pylab, example, codex (see Search examples)