

(Source code, png, pdf)
"""
====================================
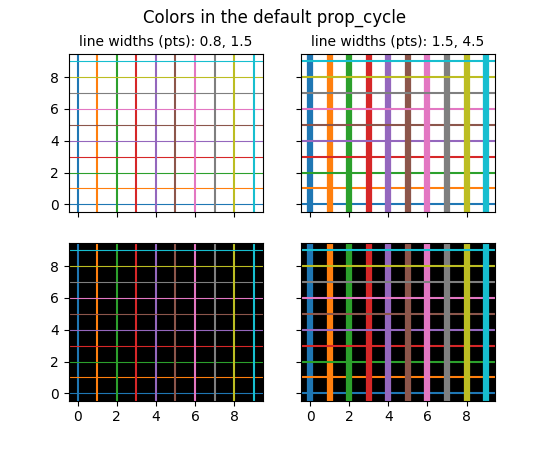
Colors in the default property cycle
====================================
Display the colors from the default prop_cycle.
"""
import numpy as np
import matplotlib.pyplot as plt
prop_cycle = plt.rcParams['axes.prop_cycle']
colors = prop_cycle.by_key()['color']
lwbase = plt.rcParams['lines.linewidth']
thin = float('%.1f' % (lwbase / 2))
thick = lwbase * 3
fig, axs = plt.subplots(nrows=2, ncols=2, sharex=True, sharey=True)
for icol in range(2):
if icol == 0:
lwx, lwy = thin, lwbase
else:
lwx, lwy = lwbase, thick
for irow in range(2):
for i, color in enumerate(colors):
axs[irow, icol].axhline(i, color=color, lw=lwx)
axs[irow, icol].axvline(i, color=color, lw=lwy)
axs[1, icol].set_facecolor('k')
axs[1, icol].xaxis.set_ticks(np.arange(0, 10, 2))
axs[0, icol].set_title('line widths (pts): %.1f, %.1f' % (lwx, lwy),
fontsize='medium')
for irow in range(2):
axs[irow, 0].yaxis.set_ticks(np.arange(0, 10, 2))
fig.suptitle('Colors in the default prop_cycle', fontsize='large')
plt.show()
Keywords: python, matplotlib, pylab, example, codex (see Search examples)