

(Source code, png, pdf)
import matplotlib.pyplot as plt
from mpl_toolkits.axes_grid1.inset_locator import zoomed_inset_axes
from mpl_toolkits.axes_grid1.inset_locator import mark_inset
import numpy as np
def get_demo_image():
from matplotlib.cbook import get_sample_data
import numpy as np
f = get_sample_data("axes_grid/bivariate_normal.npy", asfileobj=False)
z = np.load(f)
# z is a numpy array of 15x15
return z, (-3, 4, -4, 3)
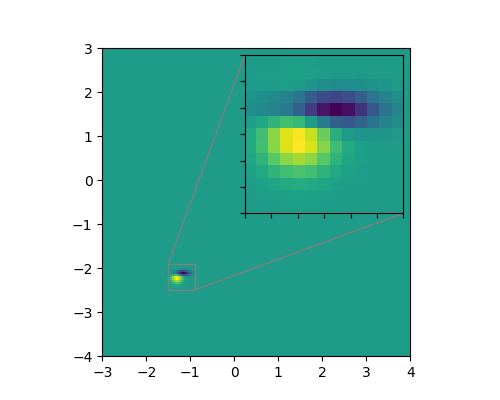
fig, ax = plt.subplots(figsize=[5, 4])
# prepare the demo image
Z, extent = get_demo_image()
Z2 = np.zeros([150, 150], dtype="d")
ny, nx = Z.shape
Z2[30:30 + ny, 30:30 + nx] = Z
# extent = [-3, 4, -4, 3]
ax.imshow(Z2, extent=extent, interpolation="nearest",
origin="lower")
axins = zoomed_inset_axes(ax, 6, loc=1) # zoom = 6
axins.imshow(Z2, extent=extent, interpolation="nearest",
origin="lower")
# sub region of the original image
x1, x2, y1, y2 = -1.5, -0.9, -2.5, -1.9
axins.set_xlim(x1, x2)
axins.set_ylim(y1, y2)
# fix the number of ticks on the inset axes
axins.yaxis.get_major_locator().set_params(nbins=7)
axins.xaxis.get_major_locator().set_params(nbins=7)
plt.xticks(visible=False)
plt.yticks(visible=False)
# draw a bbox of the region of the inset axes in the parent axes and
# connecting lines between the bbox and the inset axes area
mark_inset(ax, axins, loc1=2, loc2=4, fc="none", ec="0.5")
plt.draw()
plt.show()
Keywords: python, matplotlib, pylab, example, codex (see Search examples)