

Axes.pie(x, explode=None, labels=None, colors=None, autopct=None, pctdistance=0.6, shadow=False, labeldistance=1.1, startangle=None, radius=None, counterclock=True, wedgeprops=None, textprops=None, center=(0, 0), frame=False)¶Plot a pie chart.
Make a pie chart of array x. The fractional area of each
wedge is given by x/sum(x). If sum(x) <= 1, then the
values of x give the fractional area directly and the array
will not be normalized. The wedges are plotted
counterclockwise, by default starting from the x-axis.
| Parameters: | x : array-like
explode : array-like, optional, default: None
labels : list, optional, default: None
colors : array-like, optional, default: None
autopct : None (default), string, or function, optional
pctdistance : float, optional, default: 0.6
shadow : bool, optional, default: False
labeldistance : float, optional, default: 1.1
startangle : float, optional, default: None
radius : float, optional, default: None
counterclock : bool, optional, default: True
wedgeprops : dict, optional, default: None
textprops : dict, optional, default: None
center : list of float, optional, default: (0, 0)
frame : bool, optional, default: False
|
|---|---|
| Returns: | patches : list
texts : list
autotexts : list
|
Notes
The pie chart will probably look best if the figure and axes are square, or the Axes aspect is equal.
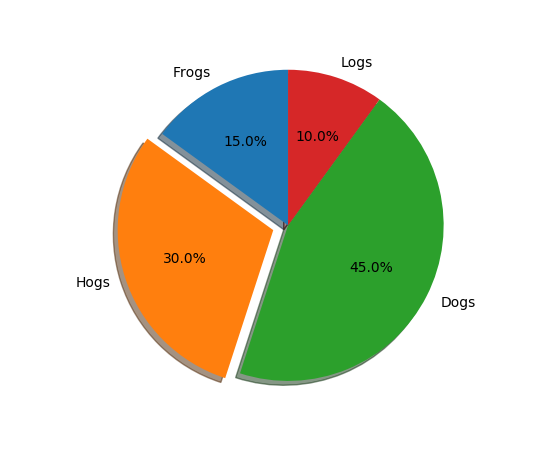
Examples
(Source code, png, pdf)
Note
In addition to the above described arguments, this function can take a data keyword argument. If such a data argument is given, the following arguments are replaced by data[<arg>]: