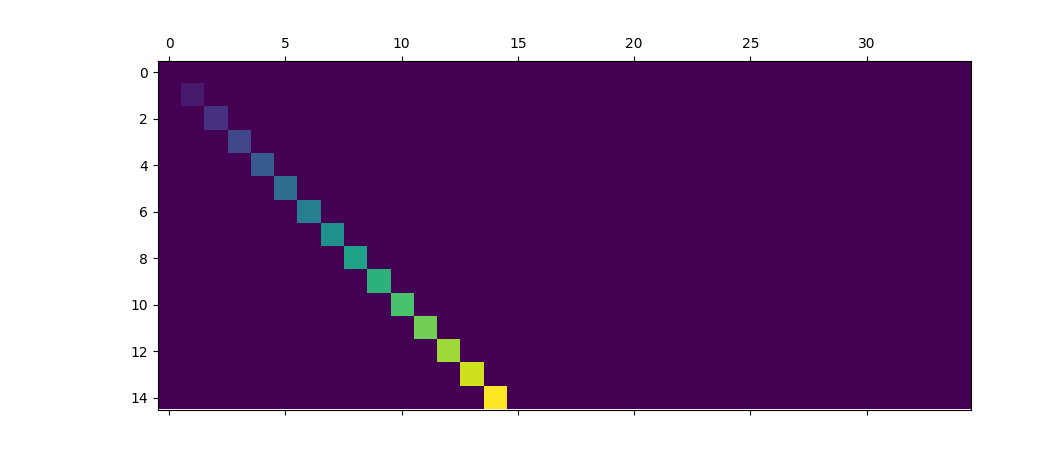
You are reading an old version of the documentation (v2.0.2). For the latest version see https://matplotlib.org/stable/api/_as_gen/matplotlib.axes.Axes.matshow.html
matplotlib

Travis-CI:

This Page

matplotlib.axes.Axes.matshow

Axes.matshow(Z, **kwargs)

Plot a matrix or array as an image.

The matrix will be shown the way it would be printed, with the first row at the top. Row and column numbering is zero-based.

Parameters:

Z : array_like shape (n, m)

The matrix to be displayed.

Returns:

image : AxesImage

Other Parameters:
 

kwargs : imshow arguments

Sets origin to ‘upper’, ‘interpolation’ to ‘nearest’ and ‘aspect’ to equal.

See also

imshow
plot an image

Examples

(Source code, png, pdf)

../../_images/matshow.png