

(Source code, png, pdf)

"""
============================================================
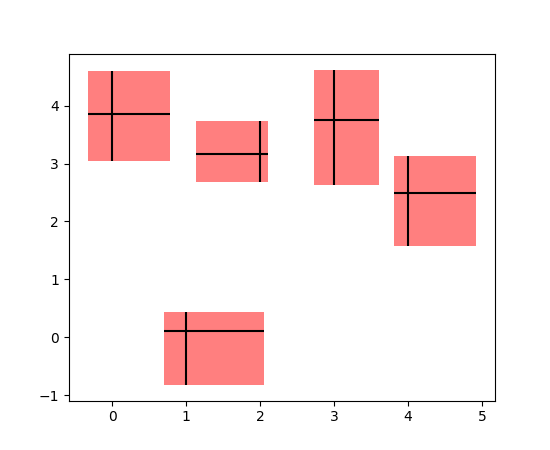
Demo on creating boxes from error bars using PatchCollection
============================================================
In this example, we snazz up a pretty standard error bar plot by adding
a rectangle patch defined by the limits of the bars in both the x- and
y- directions. To do this, we have to write our own custom function
called ``make_error_boxes``. Close inspection of this function will
reveal the preferred pattern in writing functions for matplotlib:
1. an ``Axes`` object is passed directly to the function
2. the function operates on the `Axes` methods directly, not through
the ``pyplot`` interface
3. plotting kwargs that could be abbreviated are spelled out for
better code readability in the future (for example we use
``facecolor`` instead of ``fc``)
4. the artists returned by the ``Axes`` plotting methods are then
returned by the function so that, if desired, their styles
can be modified later outside of the function (they are not
modified in this example).
"""
import numpy as np
import matplotlib.pyplot as plt
from matplotlib.collections import PatchCollection
from matplotlib.patches import Rectangle
# Number of data points
n = 5
# Dummy data
np.random.seed(10)
x = np.arange(0, n, 1)
y = np.random.rand(n) * 5.
# Dummy errors (above and below)
xerr = np.random.rand(2, n) + 0.1
yerr = np.random.rand(2, n) + 0.2
def make_error_boxes(ax, xdata, ydata, xerror, yerror, facecolor='r',
edgecolor='None', alpha=0.5):
# Create list for all the error patches
errorboxes = []
# Loop over data points; create box from errors at each point
for x, y, xe, ye in zip(xdata, ydata, xerror.T, yerror.T):
rect = Rectangle((x - xe[0], y - ye[0]), xe.sum(), ye.sum())
errorboxes.append(rect)
# Create patch collection with specified colour/alpha
pc = PatchCollection(errorboxes, facecolor=facecolor, alpha=alpha,
edgecolor=edgecolor)
# Add collection to axes
ax.add_collection(pc)
# Plot errorbars
artists = ax.errorbar(xdata, ydata, xerr=xerror, yerr=yerror,
fmt='None', ecolor='k')
return artists
# Create figure and axes
fig, ax = plt.subplots(1)
# Call function to create error boxes
_ = make_error_boxes(ax, x, y, xerr, yerr)
plt.show()
Keywords: python, matplotlib, pylab, example, codex (see Search examples)