

"""
====
XKCD
====
Shows how to create an xkcd-like plot.
"""
import matplotlib.pyplot as plt
import numpy as np
with plt.xkcd():
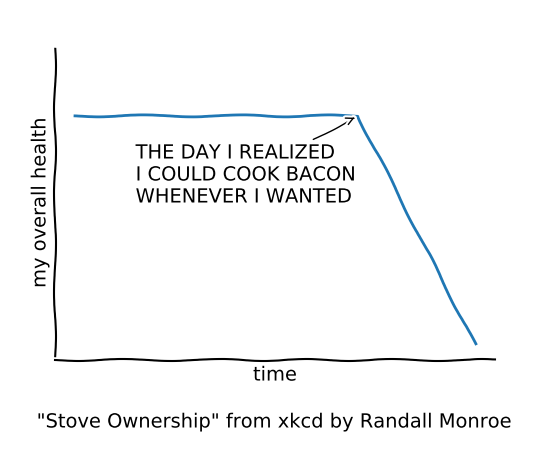
# Based on "Stove Ownership" from XKCD by Randall Monroe
# http://xkcd.com/418/
fig = plt.figure()
ax = fig.add_axes((0.1, 0.2, 0.8, 0.7))
ax.spines['right'].set_color('none')
ax.spines['top'].set_color('none')
plt.xticks([])
plt.yticks([])
ax.set_ylim([-30, 10])
data = np.ones(100)
data[70:] -= np.arange(30)
plt.annotate(
'THE DAY I REALIZED\nI COULD COOK BACON\nWHENEVER I WANTED',
xy=(70, 1), arrowprops=dict(arrowstyle='->'), xytext=(15, -10))
plt.plot(data)
plt.xlabel('time')
plt.ylabel('my overall health')
fig.text(
0.5, 0.05,
'"Stove Ownership" from xkcd by Randall Monroe',
ha='center')
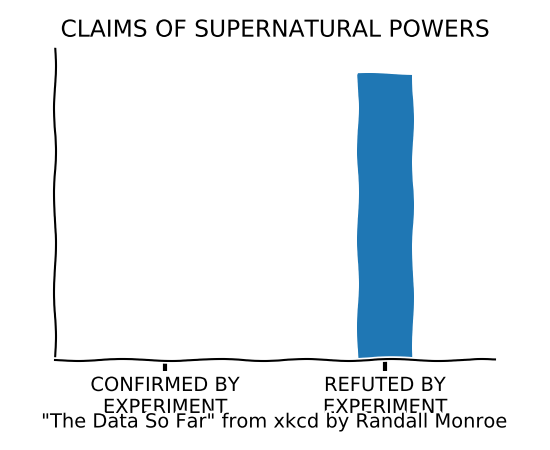
# Based on "The Data So Far" from XKCD by Randall Monroe
# http://xkcd.com/373/
fig = plt.figure()
ax = fig.add_axes((0.1, 0.2, 0.8, 0.7))
ax.bar([0, 1], [0, 100], 0.25)
ax.spines['right'].set_color('none')
ax.spines['top'].set_color('none')
ax.xaxis.set_ticks_position('bottom')
ax.set_xticks([0, 1])
ax.set_xlim([-0.5, 1.5])
ax.set_ylim([0, 110])
ax.set_xticklabels(['CONFIRMED BY\nEXPERIMENT', 'REFUTED BY\nEXPERIMENT'])
plt.yticks([])
plt.title("CLAIMS OF SUPERNATURAL POWERS")
fig.text(
0.5, 0.05,
'"The Data So Far" from xkcd by Randall Monroe',
ha='center')
plt.show()
Keywords: python, matplotlib, pylab, example, codex (see Search examples)
