

(Source code, png, pdf)
import matplotlib
import matplotlib.pyplot as plt
import matplotlib.axes as maxes
from matplotlib import rcParams
rcParams['text.usetex'] = True
rcParams['text.latex.unicode'] = True
class Axes(maxes.Axes):
"""
A hackish way to simultaneously draw texts w/ usetex=True and
usetex=False in the same figure. It does not work in the ps backend.
"""
def __init__(self, *kl, **kw):
self.usetex = kw.pop("usetex", "False")
self.preview = kw.pop("preview", "False")
maxes.Axes.__init__(self, *kl, **kw)
def draw(self, renderer):
usetex = plt.rcParams["text.usetex"]
preview = plt.rcParams["text.latex.preview"]
plt.rcParams["text.usetex"] = self.usetex
plt.rcParams["text.latex.preview"] = self.preview
maxes.Axes.draw(self, renderer)
plt.rcParams["text.usetex"] = usetex
plt.rcParams["text.latex.preview"] = preview
subplot = maxes.subplot_class_factory(Axes)
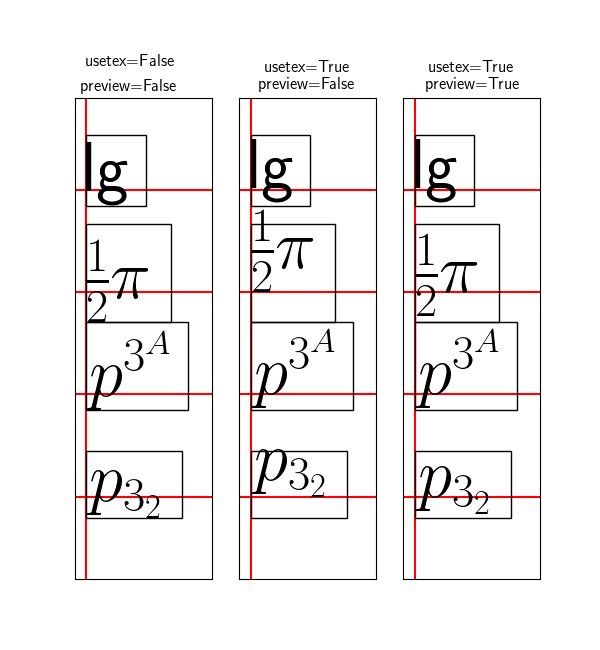
def test_window_extent(ax, usetex, preview):
va = "baseline"
ax.xaxis.set_visible(False)
ax.yaxis.set_visible(False)
#t = ax.text(0., 0., r"mlp", va="baseline", size=150)
text_kw = dict(va=va,
size=50,
bbox=dict(pad=0., ec="k", fc="none"))
test_strings = ["lg", r"$\frac{1}{2}\pi$",
r"$p^{3^A}$", r"$p_{3_2}$"]
ax.axvline(0, color="r")
for i, s in enumerate(test_strings):
ax.axhline(i, color="r")
ax.text(0., 3 - i, s, **text_kw)
ax.set_xlim(-0.1, 1.1)
ax.set_ylim(-.8, 3.9)
ax.set_title("usetex=%s\npreview=%s" % (str(usetex), str(preview)))
fig = plt.figure(figsize=(2.*3, 6.5))
for i, usetex, preview in [[0, False, False],
[1, True, False],
[2, True, True]]:
ax = subplot(fig, 1, 3, i + 1, usetex=usetex, preview=preview)
fig.add_subplot(ax)
fig.subplots_adjust(top=0.85)
test_window_extent(ax, usetex=usetex, preview=preview)
plt.draw()
plt.show()
Keywords: python, matplotlib, pylab, example, codex (see Search examples)