

(Source code, png, pdf)

"""
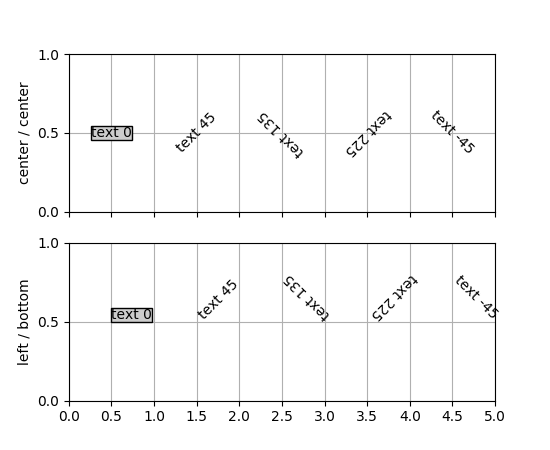
The way matplotlib does text layout is counter-intuitive to some, so
this example is designed to make it a little clearer. The text is
aligned by it's bounding box (the rectangular box that surrounds the
ink rectangle). The order of operations is basically rotation then
alignment, rather than alignment then rotation. Basically, the text
is centered at your x,y location, rotated around this point, and then
aligned according to the bounding box of the rotated text.
So if you specify left, bottom alignment, the bottom left of the
bounding box of the rotated text will be at the x,y coordinate of the
text.
But a picture is worth a thousand words!
"""
import matplotlib.pyplot as plt
import numpy as np
def addtext(props):
plt.text(0.5, 0.5, 'text 0', props, rotation=0)
plt.text(1.5, 0.5, 'text 45', props, rotation=45)
plt.text(2.5, 0.5, 'text 135', props, rotation=135)
plt.text(3.5, 0.5, 'text 225', props, rotation=225)
plt.text(4.5, 0.5, 'text -45', props, rotation=-45)
plt.yticks([0, .5, 1])
plt.grid(True)
# the text bounding box
bbox = {'fc': '0.8', 'pad': 0}
plt.subplot(211)
addtext({'ha': 'center', 'va': 'center', 'bbox': bbox})
plt.xlim(0, 5)
plt.xticks(np.arange(0, 5.1, 0.5), [])
plt.ylabel('center / center')
plt.subplot(212)
addtext({'ha': 'left', 'va': 'bottom', 'bbox': bbox})
plt.xlim(0, 5)
plt.xticks(np.arange(0, 5.1, 0.5))
plt.ylabel('left / bottom')
plt.show()
Keywords: python, matplotlib, pylab, example, codex (see Search examples)