

(Source code, png, pdf)
import numpy as np
import matplotlib.cm as cm
import matplotlib.mlab as mlab
import matplotlib.pyplot as plt
from matplotlib.path import Path
from matplotlib.patches import PathPatch
delta = 0.025
x = y = np.arange(-3.0, 3.0, delta)
X, Y = np.meshgrid(x, y)
Z1 = mlab.bivariate_normal(X, Y, 1.0, 1.0, 0.0, 0.0)
Z2 = mlab.bivariate_normal(X, Y, 1.5, 0.5, 1, 1)
Z = Z2 - Z1 # difference of Gaussians
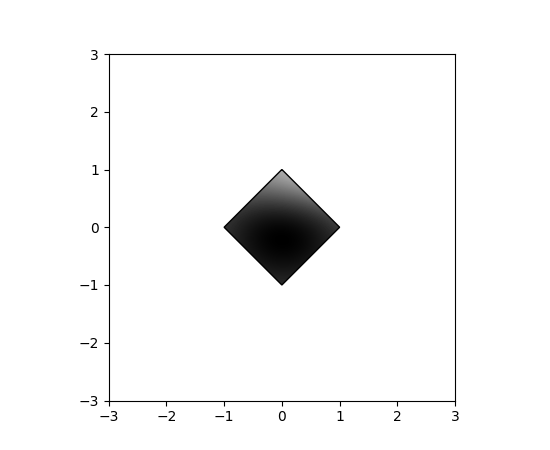
path = Path([[0, 1], [1, 0], [0, -1], [-1, 0], [0, 1]])
patch = PathPatch(path, facecolor='none')
plt.gca().add_patch(patch)
im = plt.imshow(Z, interpolation='bilinear', cmap=cm.gray,
origin='lower', extent=[-3, 3, -3, 3],
clip_path=patch, clip_on=True)
im.set_clip_path(patch)
plt.show()
Keywords: python, matplotlib, pylab, example, codex (see Search examples)