

(Source code, png, pdf)

import matplotlib.patches as mpatches
import matplotlib.pyplot as plt
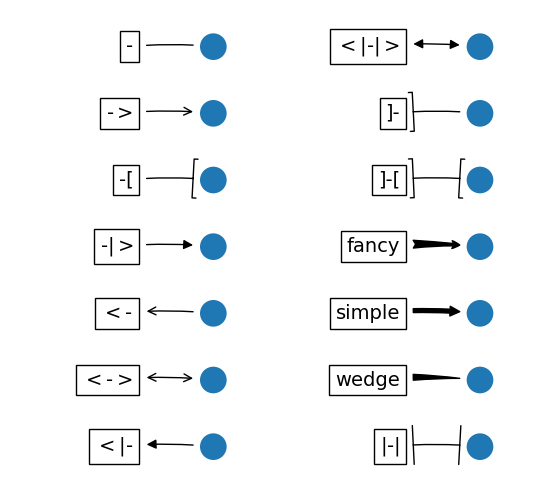
styles = mpatches.ArrowStyle.get_styles()
ncol = 2
nrow = (len(styles) + 1) // ncol
figheight = (nrow + 0.5)
fig1 = plt.figure(1, (4.*ncol/1.5, figheight/1.5))
fontsize = 0.2 * 70
ax = fig1.add_axes([0, 0, 1, 1], frameon=False, aspect=1.)
ax.set_xlim(0, 4*ncol)
ax.set_ylim(0, figheight)
def to_texstring(s):
s = s.replace("<", r"$<$")
s = s.replace(">", r"$>$")
s = s.replace("|", r"$|$")
return s
for i, (stylename, styleclass) in enumerate(sorted(styles.items())):
x = 3.2 + (i//nrow)*4
y = (figheight - 0.7 - i % nrow) # /figheight
p = mpatches.Circle((x, y), 0.2)
ax.add_patch(p)
ax.annotate(to_texstring(stylename), (x, y),
(x - 1.2, y),
#xycoords="figure fraction", textcoords="figure fraction",
ha="right", va="center",
size=fontsize,
arrowprops=dict(arrowstyle=stylename,
patchB=p,
shrinkA=5,
shrinkB=5,
fc="k", ec="k",
connectionstyle="arc3,rad=-0.05",
),
bbox=dict(boxstyle="square", fc="w"))
ax.xaxis.set_visible(False)
ax.yaxis.set_visible(False)
plt.draw()
plt.show()
Keywords: python, matplotlib, pylab, example, codex (see Search examples)