

(Source code, png, pdf)

import matplotlib.pyplot as plt
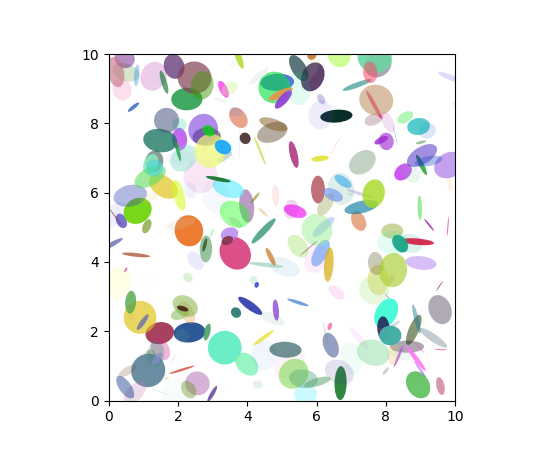
import numpy.random as rnd
from matplotlib.patches import Ellipse
NUM = 250
ells = [Ellipse(xy=rnd.rand(2)*10, width=rnd.rand(), height=rnd.rand(), angle=rnd.rand()*360)
for i in range(NUM)]
fig = plt.figure(0)
ax = fig.add_subplot(111, aspect='equal')
for e in ells:
ax.add_artist(e)
e.set_clip_box(ax.bbox)
e.set_alpha(rnd.rand())
e.set_facecolor(rnd.rand(3))
ax.set_xlim(0, 10)
ax.set_ylim(0, 10)
plt.show()
Keywords: python, matplotlib, pylab, example, codex (see Search examples)