

import matplotlib.pyplot as plt
import itertools
import warnings
fontsizes = itertools.cycle([8, 16, 24, 32])
def example_plot(ax):
ax.plot([1, 2])
ax.set_xlabel('x-label', fontsize=next(fontsizes))
ax.set_ylabel('y-label', fontsize=next(fontsizes))
ax.set_title('Title', fontsize=next(fontsizes))
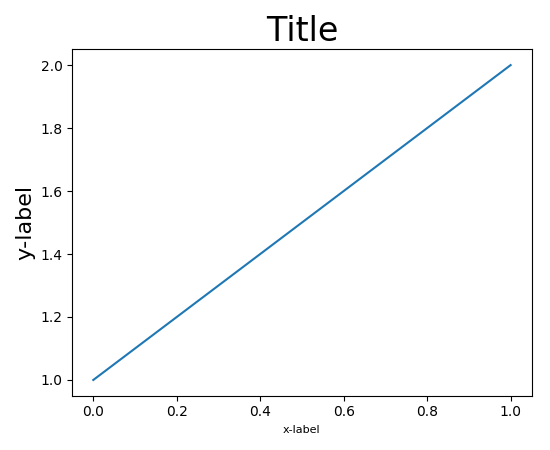
fig, ax = plt.subplots()
example_plot(ax)
plt.tight_layout()
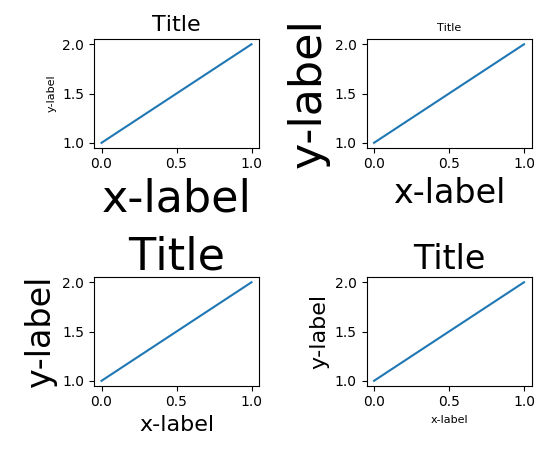
fig, ((ax1, ax2), (ax3, ax4)) = plt.subplots(nrows=2, ncols=2)
example_plot(ax1)
example_plot(ax2)
example_plot(ax3)
example_plot(ax4)
plt.tight_layout()
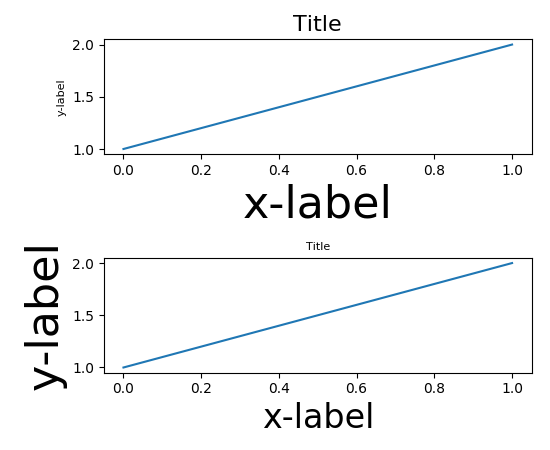
fig, (ax1, ax2) = plt.subplots(nrows=2, ncols=1)
example_plot(ax1)
example_plot(ax2)
plt.tight_layout()
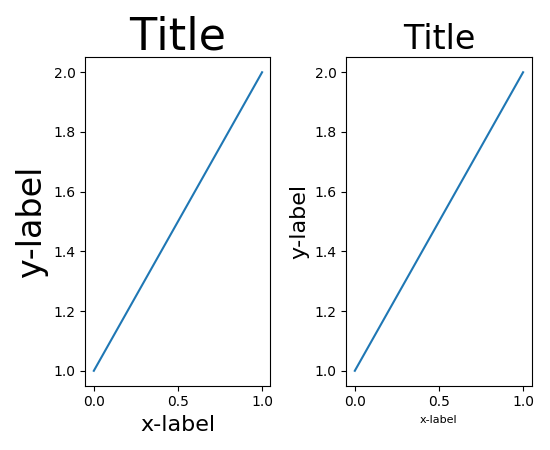
fig, (ax1, ax2) = plt.subplots(nrows=1, ncols=2)
example_plot(ax1)
example_plot(ax2)
plt.tight_layout()
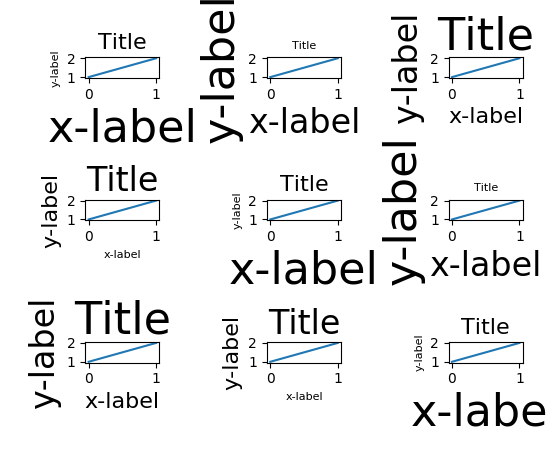
fig, axes = plt.subplots(nrows=3, ncols=3)
for row in axes:
for ax in row:
example_plot(ax)
plt.tight_layout()
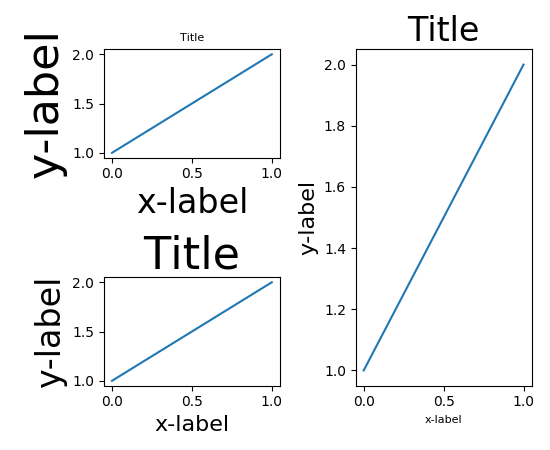
fig = plt.figure()
ax1 = plt.subplot(221)
ax2 = plt.subplot(223)
ax3 = plt.subplot(122)
example_plot(ax1)
example_plot(ax2)
example_plot(ax3)
plt.tight_layout()
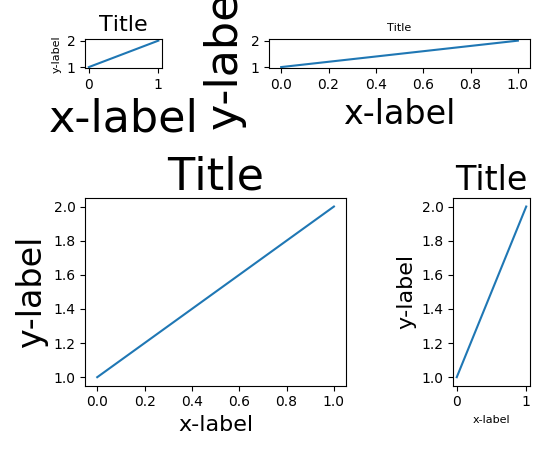
fig = plt.figure()
ax1 = plt.subplot2grid((3, 3), (0, 0))
ax2 = plt.subplot2grid((3, 3), (0, 1), colspan=2)
ax3 = plt.subplot2grid((3, 3), (1, 0), colspan=2, rowspan=2)
ax4 = plt.subplot2grid((3, 3), (1, 2), rowspan=2)
example_plot(ax1)
example_plot(ax2)
example_plot(ax3)
example_plot(ax4)
plt.tight_layout()
plt.show()
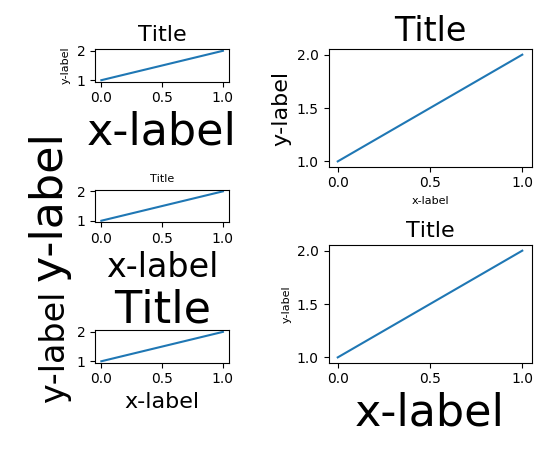
fig = plt.figure()
import matplotlib.gridspec as gridspec
gs1 = gridspec.GridSpec(3, 1)
ax1 = fig.add_subplot(gs1[0])
ax2 = fig.add_subplot(gs1[1])
ax3 = fig.add_subplot(gs1[2])
example_plot(ax1)
example_plot(ax2)
example_plot(ax3)
with warnings.catch_warnings():
warnings.simplefilter("ignore", UserWarning)
# This raises warnings since tight layout cannot
# handle gridspec automatically. We are going to
# do that manually so we can filter the warning.
gs1.tight_layout(fig, rect=[None, None, 0.45, None])
gs2 = gridspec.GridSpec(2, 1)
ax4 = fig.add_subplot(gs2[0])
ax5 = fig.add_subplot(gs2[1])
example_plot(ax4)
example_plot(ax5)
with warnings.catch_warnings():
# This raises warnings since tight layout cannot
# handle gridspec automatically. We are going to
# do that manually so we can filter the warning.
warnings.simplefilter("ignore", UserWarning)
gs2.tight_layout(fig, rect=[0.45, None, None, None])
# now match the top and bottom of two gridspecs.
top = min(gs1.top, gs2.top)
bottom = max(gs1.bottom, gs2.bottom)
gs1.update(top=top, bottom=bottom)
gs2.update(top=top, bottom=bottom)
plt.show()
Keywords: python, matplotlib, pylab, example, codex (see Search examples)


