

(Source code, png, pdf)

"""
An example of how to interact with the plotting canvas by connecting
to move and click events
"""
from __future__ import print_function
import sys
import matplotlib.pyplot as plt
import numpy as np
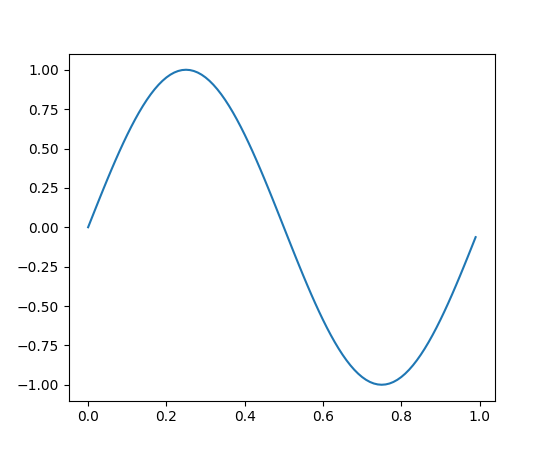
t = np.arange(0.0, 1.0, 0.01)
s = np.sin(2*np.pi*t)
fig, ax = plt.subplots()
ax.plot(t, s)
def on_move(event):
# get the x and y pixel coords
x, y = event.x, event.y
if event.inaxes:
ax = event.inaxes # the axes instance
print('data coords %f %f' % (event.xdata, event.ydata))
def on_click(event):
# get the x and y coords, flip y from top to bottom
x, y = event.x, event.y
if event.button == 1:
if event.inaxes is not None:
print('data coords %f %f' % (event.xdata, event.ydata))
binding_id = plt.connect('motion_notify_event', on_move)
plt.connect('button_press_event', on_click)
if "test_disconnect" in sys.argv:
print("disconnecting console coordinate printout...")
plt.disconnect(binding_id)
plt.show()
Keywords: python, matplotlib, pylab, example, codex (see Search examples)