

import matplotlib.pyplot as plt
import numpy as np
# fake up some data
spread = np.random.rand(50) * 100
center = np.ones(25) * 50
flier_high = np.random.rand(10) * 100 + 100
flier_low = np.random.rand(10) * -100
data = np.concatenate((spread, center, flier_high, flier_low), 0)
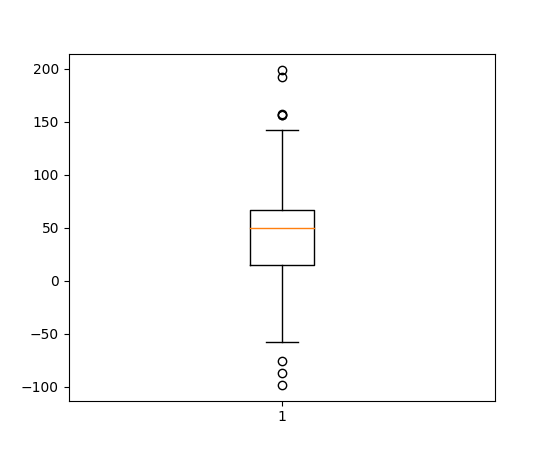
# basic plot
plt.boxplot(data)
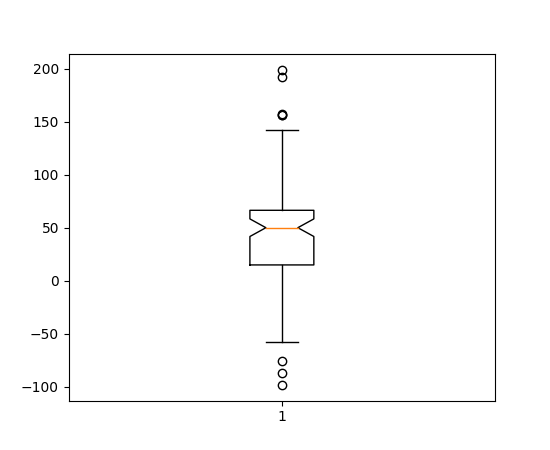
# notched plot
plt.figure()
plt.boxplot(data, 1)
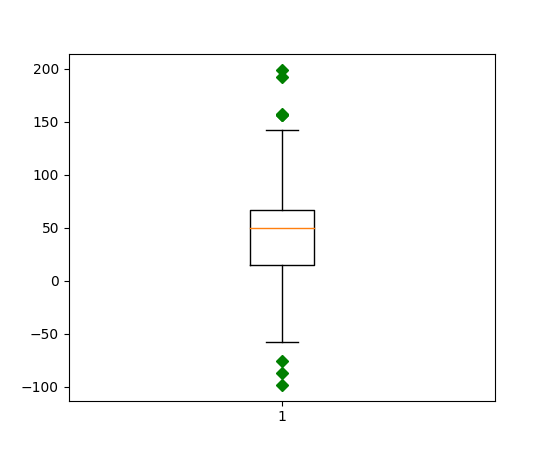
# change outlier point symbols
plt.figure()
plt.boxplot(data, 0, 'gD')
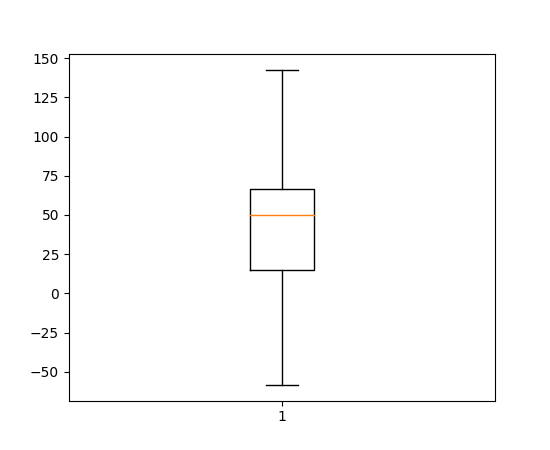
# don't show outlier points
plt.figure()
plt.boxplot(data, 0, '')
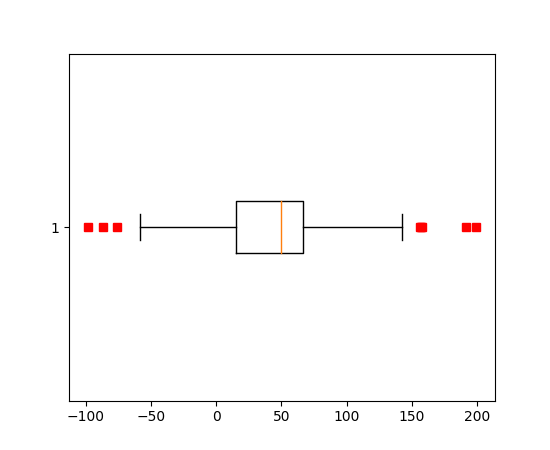
# horizontal boxes
plt.figure()
plt.boxplot(data, 0, 'rs', 0)
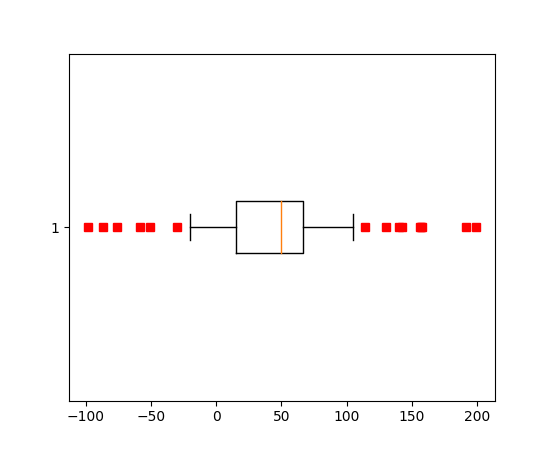
# change whisker length
plt.figure()
plt.boxplot(data, 0, 'rs', 0, 0.75)
# fake up some more data
spread = np.random.rand(50) * 100
center = np.ones(25) * 40
flier_high = np.random.rand(10) * 100 + 100
flier_low = np.random.rand(10) * -100
d2 = np.concatenate((spread, center, flier_high, flier_low), 0)
data.shape = (-1, 1)
d2.shape = (-1, 1)
# data = concatenate( (data, d2), 1 )
# Making a 2-D array only works if all the columns are the
# same length. If they are not, then use a list instead.
# This is actually more efficient because boxplot converts
# a 2-D array into a list of vectors internally anyway.
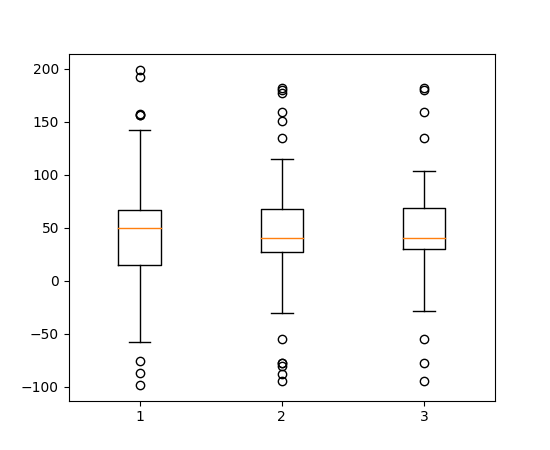
data = [data, d2, d2[::2, 0]]
# multiple box plots on one figure
plt.figure()
plt.boxplot(data)
plt.show()
Keywords: python, matplotlib, pylab, example, codex (see Search examples)
