

(Source code, png, pdf)
"""
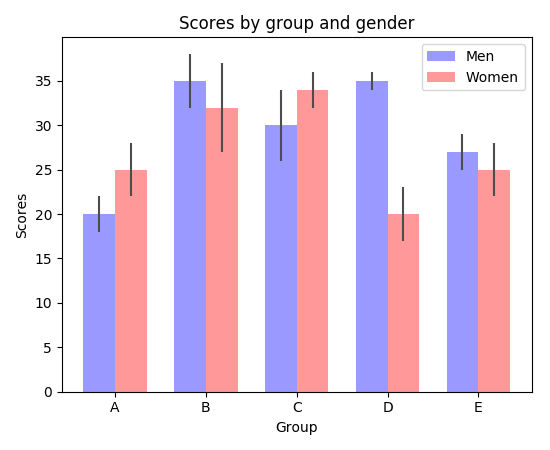
Bar chart demo with pairs of bars grouped for easy comparison.
"""
import numpy as np
import matplotlib.pyplot as plt
n_groups = 5
means_men = (20, 35, 30, 35, 27)
std_men = (2, 3, 4, 1, 2)
means_women = (25, 32, 34, 20, 25)
std_women = (3, 5, 2, 3, 3)
fig, ax = plt.subplots()
index = np.arange(n_groups)
bar_width = 0.35
opacity = 0.4
error_config = {'ecolor': '0.3'}
rects1 = plt.bar(index, means_men, bar_width,
alpha=opacity,
color='b',
yerr=std_men,
error_kw=error_config,
label='Men')
rects2 = plt.bar(index + bar_width, means_women, bar_width,
alpha=opacity,
color='r',
yerr=std_women,
error_kw=error_config,
label='Women')
plt.xlabel('Group')
plt.ylabel('Scores')
plt.title('Scores by group and gender')
plt.xticks(index + bar_width / 2, ('A', 'B', 'C', 'D', 'E'))
plt.legend()
plt.tight_layout()
plt.show()
Keywords: python, matplotlib, pylab, example, codex (see Search examples)