

(Source code, png, pdf)
"""
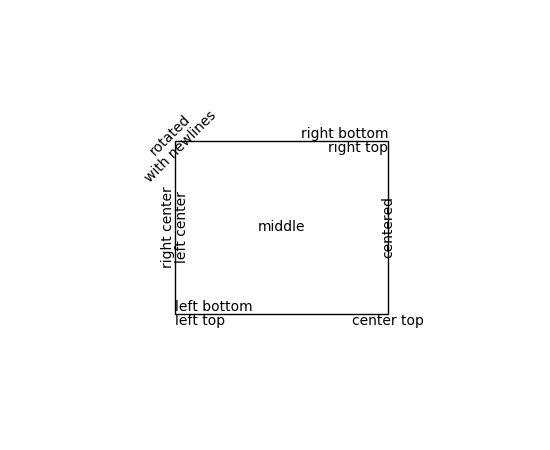
You can precisely layout text in data or axes (0,1) coordinates. This
example shows you some of the alignment and rotation specifications to
layout text
"""
import matplotlib.pyplot as plt
from matplotlib.lines import Line2D
from matplotlib.patches import Rectangle
# build a rectangle in axes coords
left, width = .25, .5
bottom, height = .25, .5
right = left + width
top = bottom + height
ax = plt.gca()
p = plt.Rectangle((left, bottom), width, height,
fill=False,
)
p.set_transform(ax.transAxes)
p.set_clip_on(False)
ax.add_patch(p)
ax.text(left, bottom, 'left top',
horizontalalignment='left',
verticalalignment='top',
transform=ax.transAxes)
ax.text(left, bottom, 'left bottom',
horizontalalignment='left',
verticalalignment='bottom',
transform=ax.transAxes)
ax.text(right, top, 'right bottom',
horizontalalignment='right',
verticalalignment='bottom',
transform=ax.transAxes)
ax.text(right, top, 'right top',
horizontalalignment='right',
verticalalignment='top',
transform=ax.transAxes)
ax.text(right, bottom, 'center top',
horizontalalignment='center',
verticalalignment='top',
transform=ax.transAxes)
ax.text(left, 0.5*(bottom + top), 'right center',
horizontalalignment='right',
verticalalignment='center',
rotation='vertical',
transform=ax.transAxes)
ax.text(left, 0.5*(bottom + top), 'left center',
horizontalalignment='left',
verticalalignment='center',
rotation='vertical',
transform=ax.transAxes)
ax.text(0.5*(left + right), 0.5*(bottom + top), 'middle',
horizontalalignment='center',
verticalalignment='center',
transform=ax.transAxes)
ax.text(right, 0.5*(bottom + top), 'centered',
horizontalalignment='center',
verticalalignment='center',
rotation='vertical',
transform=ax.transAxes)
ax.text(left, top, 'rotated\nwith newlines',
horizontalalignment='center',
verticalalignment='center',
rotation=45,
transform=ax.transAxes)
plt.axis('off')
plt.show()
Keywords: python, matplotlib, pylab, example, codex (see Search examples)