

(Source code, png, pdf)

"""
==========================
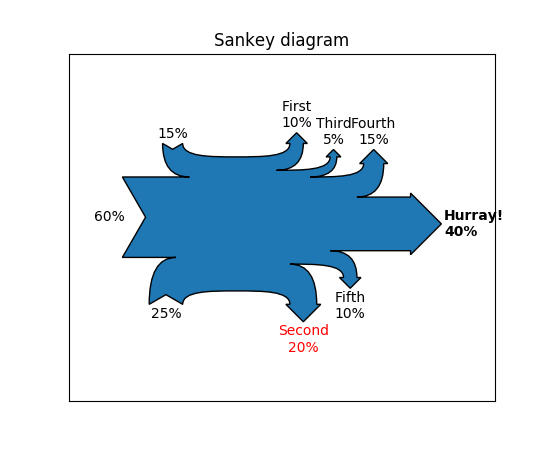
Yet another Sankey diagram
==========================
This example showcases a more complex sankey diagram.
"""
from __future__ import print_function
__author__ = "Yannick Copin <[email protected]>"
__version__ = "Time-stamp: <10/02/2010 16:49 [email protected]>"
import numpy as np
def sankey(ax,
outputs=[100.], outlabels=None,
inputs=[100.], inlabels='',
dx=40, dy=10, outangle=45, w=3, inangle=30, offset=2, **kwargs):
"""Draw a Sankey diagram.
outputs: array of outputs, should sum up to 100%
outlabels: output labels (same length as outputs),
or None (use default labels) or '' (no labels)
inputs and inlabels: similar for inputs
dx: horizontal elongation
dy: vertical elongation
outangle: output arrow angle [deg]
w: output arrow shoulder
inangle: input dip angle
offset: text offset
**kwargs: propagated to Patch (e.g., fill=False)
Return (patch,[intexts,outtexts]).
"""
import matplotlib.patches as mpatches
from matplotlib.path import Path
outs = np.absolute(outputs)
outsigns = np.sign(outputs)
outsigns[-1] = 0 # Last output
ins = np.absolute(inputs)
insigns = np.sign(inputs)
insigns[0] = 0 # First input
assert sum(outs) == 100, "Outputs don't sum up to 100%"
assert sum(ins) == 100, "Inputs don't sum up to 100%"
def add_output(path, loss, sign=1):
# Arrow tip height
h = (loss/2 + w) * np.tan(np.radians(outangle))
move, (x, y) = path[-1] # Use last point as reference
if sign == 0: # Final loss (horizontal)
path.extend([(Path.LINETO, [x + dx, y]),
(Path.LINETO, [x + dx, y + w]),
(Path.LINETO, [x + dx + h, y - loss/2]), # Tip
(Path.LINETO, [x + dx, y - loss - w]),
(Path.LINETO, [x + dx, y - loss])])
outtips.append((sign, path[-3][1]))
else: # Intermediate loss (vertical)
path.extend([(Path.CURVE4, [x + dx/2, y]),
(Path.CURVE4, [x + dx, y]),
(Path.CURVE4, [x + dx, y + sign*dy]),
(Path.LINETO, [x + dx - w, y + sign*dy]),
# Tip
(Path.LINETO, [
x + dx + loss/2, y + sign*(dy + h)]),
(Path.LINETO, [x + dx + loss + w, y + sign*dy]),
(Path.LINETO, [x + dx + loss, y + sign*dy]),
(Path.CURVE3, [x + dx + loss, y - sign*loss]),
(Path.CURVE3, [x + dx/2 + loss, y - sign*loss])])
outtips.append((sign, path[-5][1]))
def add_input(path, gain, sign=1):
h = (gain / 2) * np.tan(np.radians(inangle)) # Dip depth
move, (x, y) = path[-1] # Use last point as reference
if sign == 0: # First gain (horizontal)
path.extend([(Path.LINETO, [x - dx, y]),
(Path.LINETO, [x - dx + h, y + gain/2]), # Dip
(Path.LINETO, [x - dx, y + gain])])
xd, yd = path[-2][1] # Dip position
indips.append((sign, [xd - h, yd]))
else: # Intermediate gain (vertical)
path.extend([(Path.CURVE4, [x - dx/2, y]),
(Path.CURVE4, [x - dx, y]),
(Path.CURVE4, [x - dx, y + sign*dy]),
# Dip
(Path.LINETO, [
x - dx - gain / 2, y + sign*(dy - h)]),
(Path.LINETO, [x - dx - gain, y + sign*dy]),
(Path.CURVE3, [x - dx - gain, y - sign*gain]),
(Path.CURVE3, [x - dx/2 - gain, y - sign*gain])])
xd, yd = path[-4][1] # Dip position
indips.append((sign, [xd, yd + sign*h]))
outtips = [] # Output arrow tip dir. and positions
urpath = [(Path.MOVETO, [0, 100])] # 1st point of upper right path
lrpath = [(Path.LINETO, [0, 0])] # 1st point of lower right path
for loss, sign in zip(outs, outsigns):
add_output(sign >= 0 and urpath or lrpath, loss, sign=sign)
indips = [] # Input arrow tip dir. and positions
llpath = [(Path.LINETO, [0, 0])] # 1st point of lower left path
ulpath = [(Path.MOVETO, [0, 100])] # 1st point of upper left path
for gain, sign in reversed(list(zip(ins, insigns))):
add_input(sign <= 0 and llpath or ulpath, gain, sign=sign)
def revert(path):
"""A path is not just revertable by path[::-1] because of Bezier
curves."""
rpath = []
nextmove = Path.LINETO
for move, pos in path[::-1]:
rpath.append((nextmove, pos))
nextmove = move
return rpath
# Concatenate subpathes in correct order
path = urpath + revert(lrpath) + llpath + revert(ulpath)
codes, verts = zip(*path)
verts = np.array(verts)
# Path patch
path = Path(verts, codes)
patch = mpatches.PathPatch(path, **kwargs)
ax.add_patch(patch)
if False: # DEBUG
print("urpath", urpath)
print("lrpath", revert(lrpath))
print("llpath", llpath)
print("ulpath", revert(ulpath))
xs, ys = zip(*verts)
ax.plot(xs, ys, 'go-')
# Labels
def set_labels(labels, values):
"""Set or check labels according to values."""
if labels == '': # No labels
return labels
elif labels is None: # Default labels
return ['%2d%%' % val for val in values]
else:
assert len(labels) == len(values)
return labels
def put_labels(labels, positions, output=True):
"""Put labels to positions."""
texts = []
lbls = output and labels or labels[::-1]
for i, label in enumerate(lbls):
s, (x, y) = positions[i] # Label direction and position
if s == 0:
t = ax.text(x + offset, y, label,
ha=output and 'left' or 'right', va='center')
elif s > 0:
t = ax.text(x, y + offset, label, ha='center', va='bottom')
else:
t = ax.text(x, y - offset, label, ha='center', va='top')
texts.append(t)
return texts
outlabels = set_labels(outlabels, outs)
outtexts = put_labels(outlabels, outtips, output=True)
inlabels = set_labels(inlabels, ins)
intexts = put_labels(inlabels, indips, output=False)
# Axes management
ax.set_xlim(verts[:, 0].min() - dx, verts[:, 0].max() + dx)
ax.set_ylim(verts[:, 1].min() - dy, verts[:, 1].max() + dy)
ax.set_aspect('equal', adjustable='datalim')
return patch, [intexts, outtexts]
if __name__ == '__main__':
import matplotlib.pyplot as plt
outputs = [10., -20., 5., 15., -10., 40.]
outlabels = ['First', 'Second', 'Third', 'Fourth', 'Fifth', 'Hurray!']
outlabels = [s + '\n%d%%' % abs(l) for l, s in zip(outputs, outlabels)]
inputs = [60., -25., 15.]
fig = plt.figure()
ax = fig.add_subplot(1, 1, 1, xticks=[], yticks=[], title="Sankey diagram")
patch, (intexts, outtexts) = sankey(ax, outputs=outputs,
outlabels=outlabels, inputs=inputs,
inlabels=None)
outtexts[1].set_color('r')
outtexts[-1].set_fontweight('bold')
plt.show()
Keywords: python, matplotlib, pylab, example, codex (see Search examples)