

(Source code, png, pdf)

'''
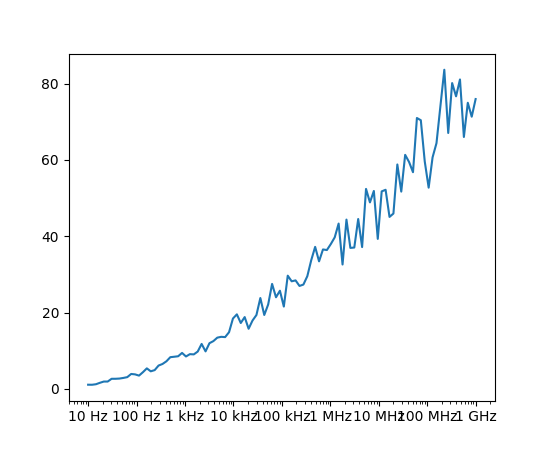
=========================================
Labeling ticks using engineering notation
=========================================
Demo to show use of the engineering Formatter.
'''
import matplotlib.pyplot as plt
import numpy as np
from matplotlib.ticker import EngFormatter
prng = np.random.RandomState(123)
fig, ax = plt.subplots()
ax.set_xscale('log')
formatter = EngFormatter(unit='Hz')
ax.xaxis.set_major_formatter(formatter)
xs = np.logspace(1, 9, 100)
ys = (0.8 + 0.4 * prng.uniform(size=100)) * np.log10(xs)**2
ax.plot(xs, ys)
plt.show()
Keywords: python, matplotlib, pylab, example, codex (see Search examples)