

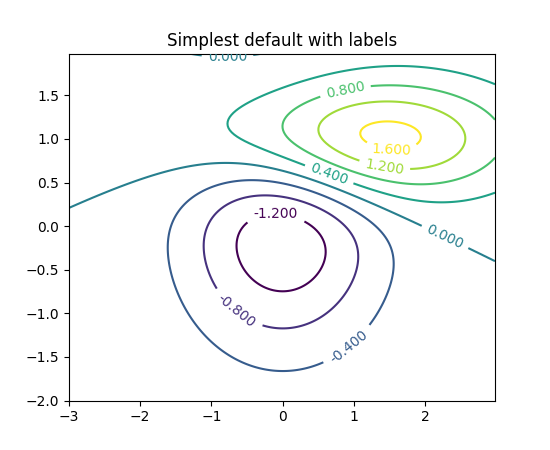
Axes.clabel(CS, *args, **kwargs)¶Label a contour plot.
Call signature:
clabel(cs, **kwargs)
Adds labels to line contours in cs, where cs is a
ContourSet object returned by
contour.
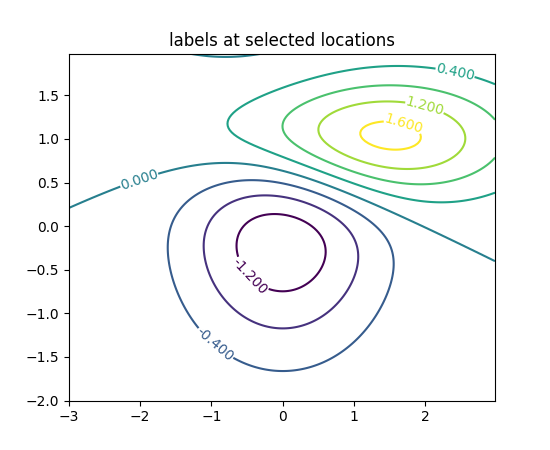
clabel(cs, v, **kwargs)
only labels contours listed in v.
Optional keyword arguments:
- fontsize:
- size in points or relative size e.g., ‘smaller’, ‘x-large’
- colors:
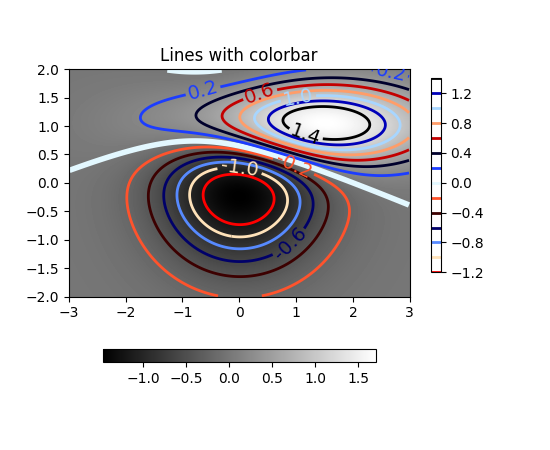
- if None, the color of each label matches the color of the corresponding contour
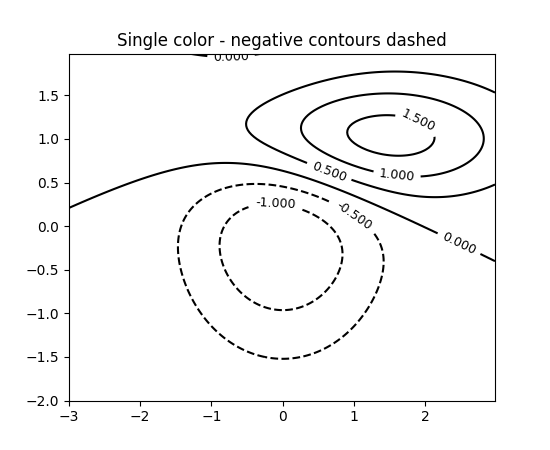
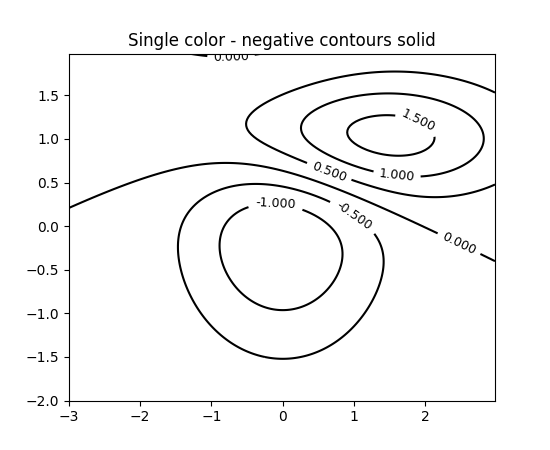
- if one string color, e.g., colors = ‘r’ or colors = ‘red’, all labels will be plotted in this color
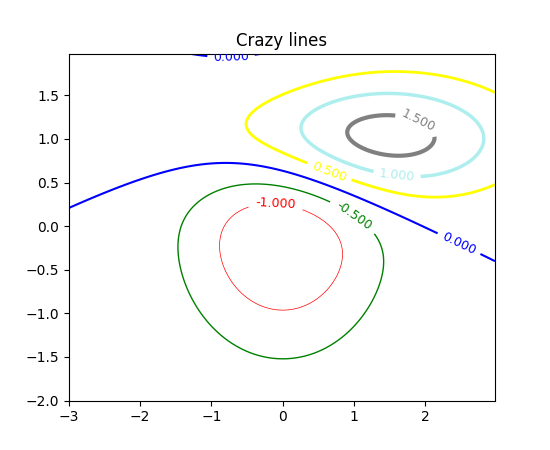
- if a tuple of matplotlib color args (string, float, rgb, etc), different labels will be plotted in different colors in the order specified
- inline:
- controls whether the underlying contour is removed or not. Default is True.
- inline_spacing:
- space in pixels to leave on each side of label when placing inline. Defaults to 5. This spacing will be exact for labels at locations where the contour is straight, less so for labels on curved contours.
- fmt:
- a format string for the label. Default is ‘%1.3f’ Alternatively, this can be a dictionary matching contour levels with arbitrary strings to use for each contour level (i.e., fmt[level]=string), or it can be any callable, such as a
Formatterinstance, that returns a string when called with a numeric contour level.- manual:
if True, contour labels will be placed manually using mouse clicks. Click the first button near a contour to add a label, click the second button (or potentially both mouse buttons at once) to finish adding labels. The third button can be used to remove the last label added, but only if labels are not inline. Alternatively, the keyboard can be used to select label locations (enter to end label placement, delete or backspace act like the third mouse button, and any other key will select a label location).
manual can be an iterable object of x,y tuples. Contour labels will be created as if mouse is clicked at each x,y positions.
- rightside_up:
- if True (default), label rotations will always be plus or minus 90 degrees from level.
- use_clabeltext:
- if True (default is False), ClabelText class (instead of matplotlib.Text) is used to create labels. ClabelText recalculates rotation angles of texts during the drawing time, therefore this can be used if aspect of the axes changes.

