

GridSpec- specifies the geometry of the grid that a subplot will be placed. The number of rows and number of columns of the grid need to be set. Optionally, the subplot layout parameters (e.g., left, right, etc.) can be tuned.
SubplotSpec- specifies the location of the subplot in the given GridSpec.
subplot2grid- a helper function that is similar to “pyplot.subplot” but uses 0-based indexing and let subplot to occupy multiple cells.
To use subplot2grid, you provide geometry of the grid and the location of the subplot in the grid. For a simple single-cell subplot:
ax = plt.subplot2grid((2,2),(0, 0))
is identical to
ax = plt.subplot(2,2,1)
Note that, unlike matplotlib’s subplot, the index starts from 0 in gridspec.
To create a subplot that spans multiple cells,
ax2 = plt.subplot2grid((3,3), (1, 0), colspan=2)
ax3 = plt.subplot2grid((3,3), (1, 2), rowspan=2)
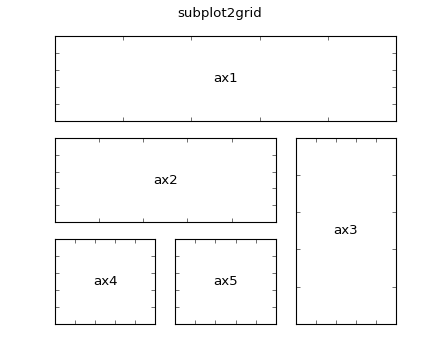
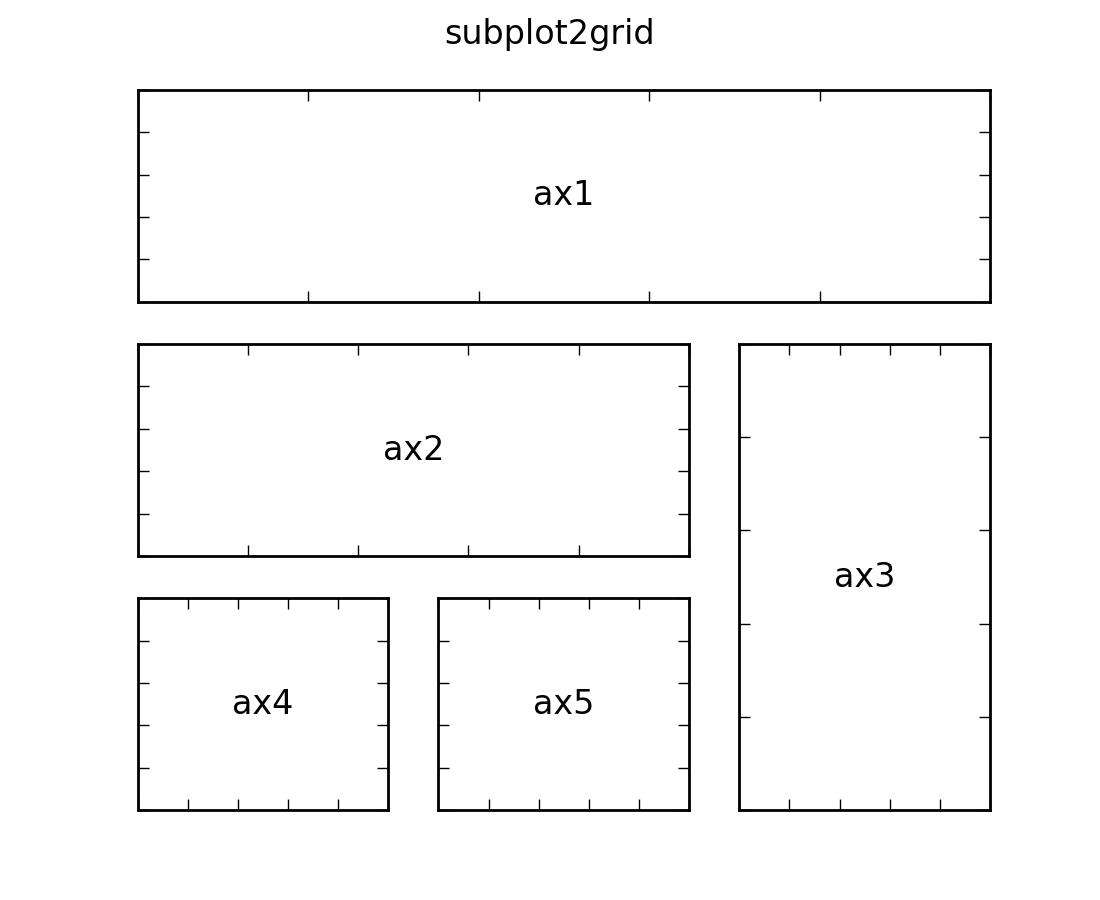
For example, the following commands
ax1 = plt.subplot2grid((3,3), (0,0), colspan=3)
ax2 = plt.subplot2grid((3,3), (1,0), colspan=2)
ax3 = plt.subplot2grid((3,3), (1, 2), rowspan=2)
ax4 = plt.subplot2grid((3,3), (2, 0))
ax5 = plt.subplot2grid((3,3), (2, 1))
creates
(Source code, png, hires.png, pdf)
You can create GridSpec explicitly and use them to create a Subplot.
For example,
ax = plt.subplot2grid((2,2),(0, 0))
is equal to
import matplotlib.gridspec as gridspec
gs = gridspec.GridSpec(2, 2)
ax = plt.subplot(gs[0, 0])
A gridspec instance provides array-like (2d or 1d) indexing that returns the SubplotSpec instance. For, SubplotSpec that spans multiple cells, use slice.
ax2 = plt.subplot(gs[1,:-1])
ax3 = plt.subplot(gs[1:, -1])
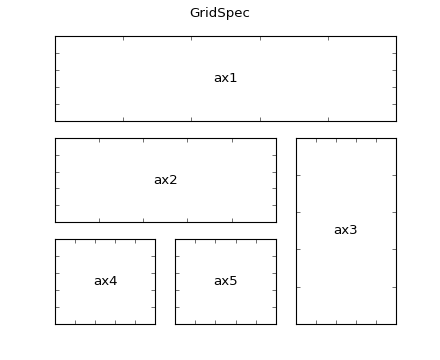
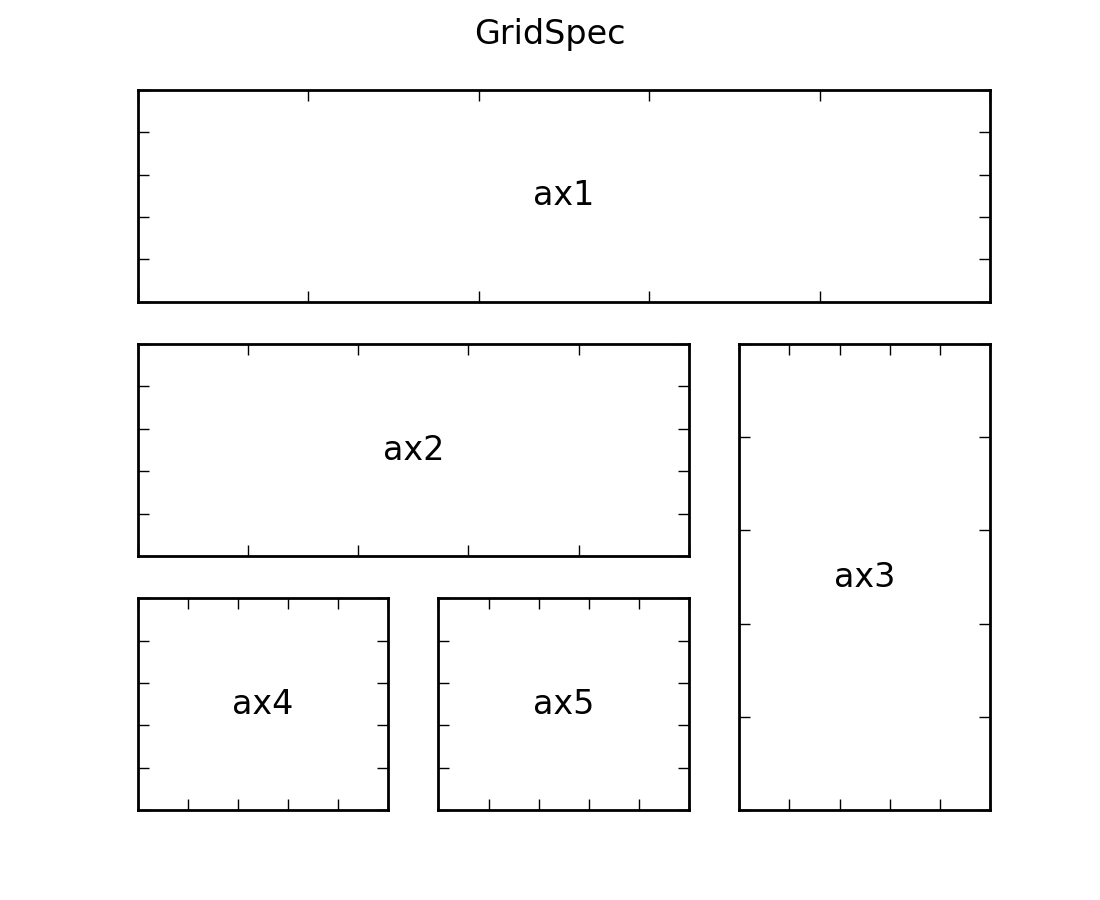
The above example becomes
gs = gridspec.GridSpec(3, 3)
ax1 = plt.subplot(gs[0, :])
ax2 = plt.subplot(gs[1,:-1])
ax3 = plt.subplot(gs[1:, -1])
ax4 = plt.subplot(gs[-1,0])
ax5 = plt.subplot(gs[-1,-2])
(Source code, png, hires.png, pdf)
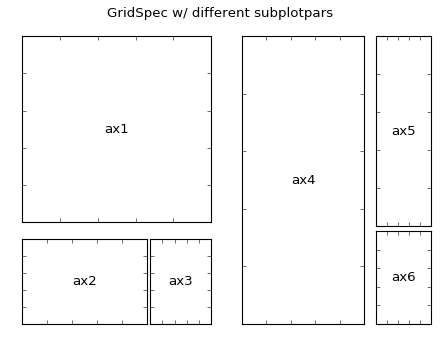
When a GridSpec is explicitly used, you can adjust the layout parameters of subplots that are created from the gridspec.
gs1 = gridspec.GridSpec(3, 3)
gs1.update(left=0.05, right=0.48, wspace=0.05)
This is similar to subplots_adjust, but it only affects the subplots that are created from the given GridSpec.
The code below
gs1 = gridspec.GridSpec(3, 3)
gs1.update(left=0.05, right=0.48, wspace=0.05)
ax1 = plt.subplot(gs1[:-1, :])
ax2 = plt.subplot(gs1[-1, :-1])
ax3 = plt.subplot(gs1[-1, -1])

gs2 = gridspec.GridSpec(3, 3)
gs2.update(left=0.55, right=0.98, hspace=0.05)
ax4 = plt.subplot(gs2[:, :-1])
ax5 = plt.subplot(gs2[:-1, -1])
ax6 = plt.subplot(gs2[-1, -1])
creates
(Source code, png, hires.png, pdf)

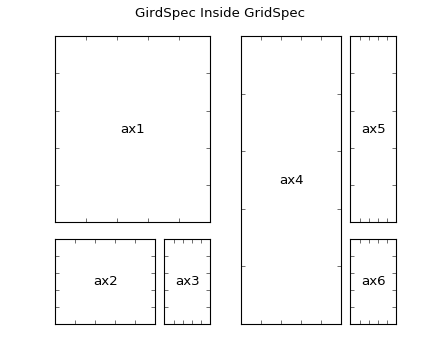
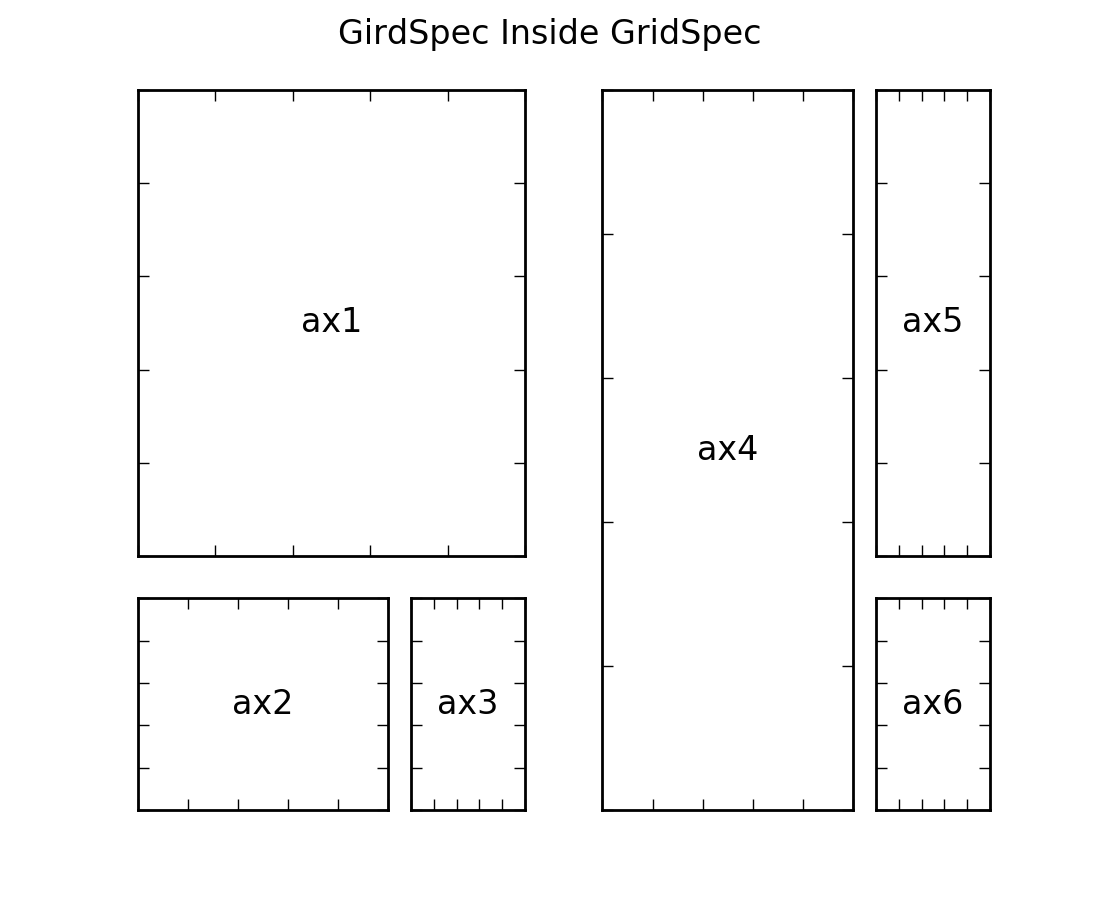
You can create GridSpec from the SubplotSpec, in which case its layout parameters are set to that of the location of the given SubplotSpec.
gs0 = gridspec.GridSpec(1, 2)

gs00 = gridspec.GridSpecFromSubplotSpec(3, 3, subplot_spec=gs0[0])
gs01 = gridspec.GridSpecFromSubplotSpec(3, 3, subplot_spec=gs0[1])
(Source code, png, hires.png, pdf)
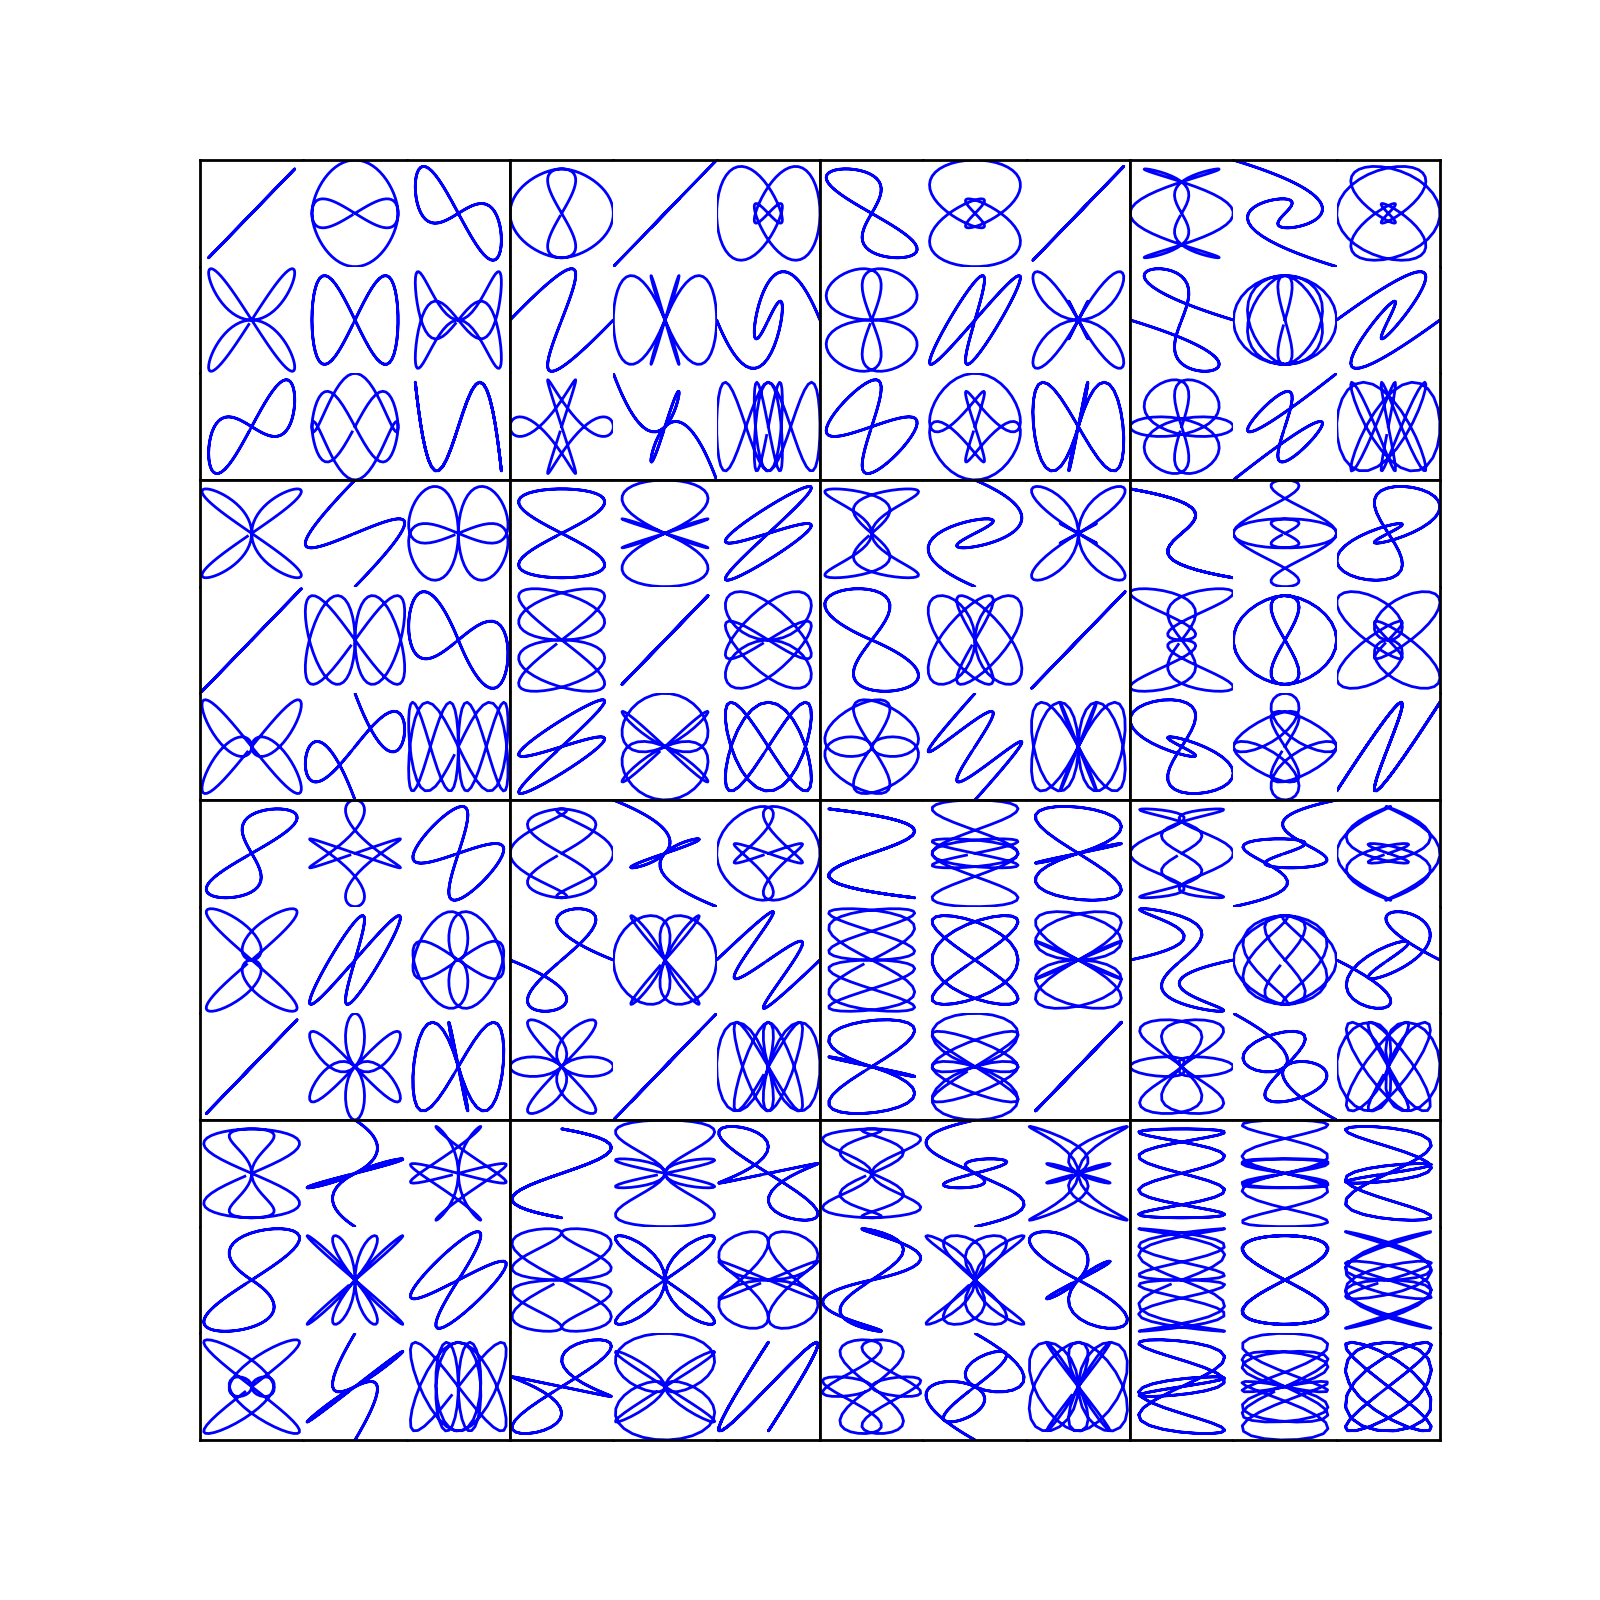
Here’s a more sophisticated example of nested gridspec where we put a box around each cell of the outer 4x4 grid, by hiding appropriate spines in each of the inner 3x3 grids.
(Source code, png, hires.png, pdf)

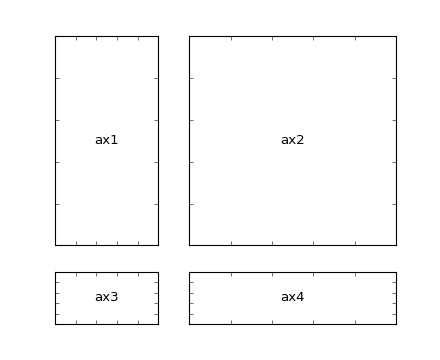
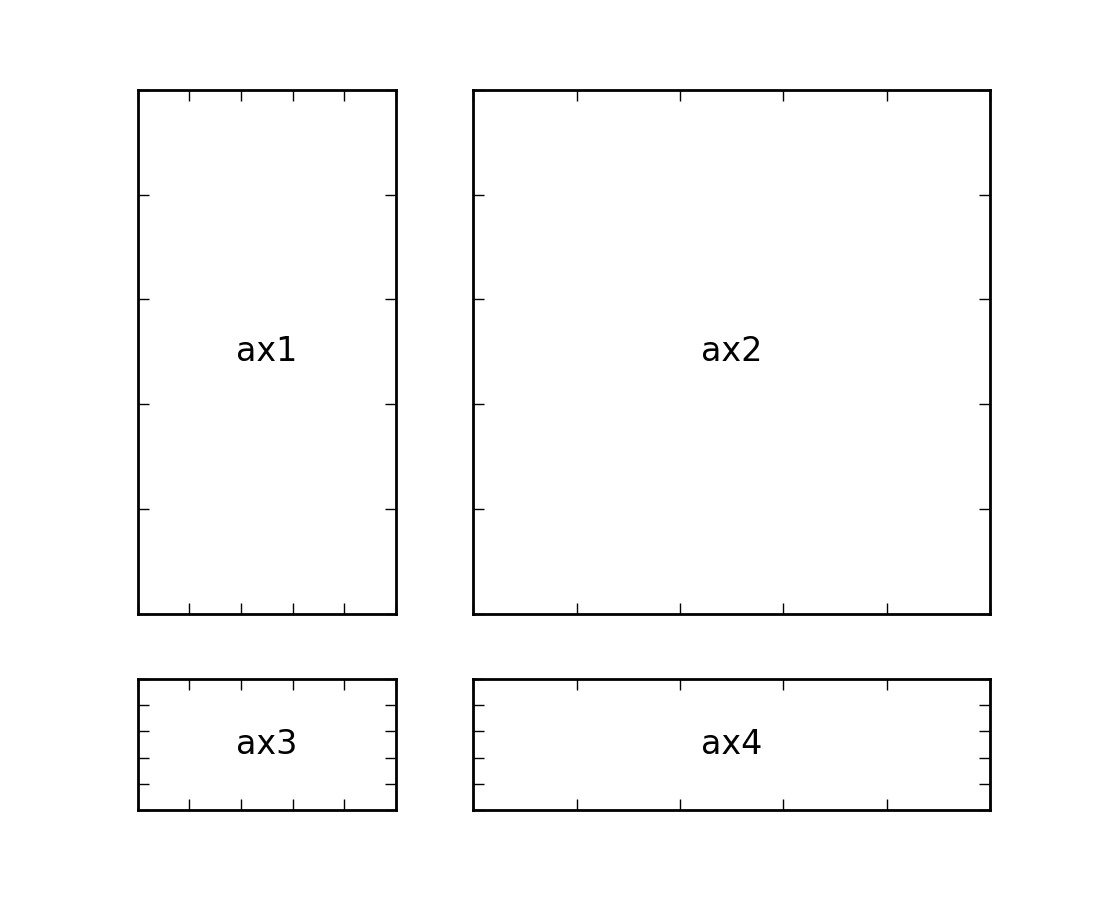
By default, GridSpec creates cells of equal sizes. You can adjust relative heights and widths of rows and columns. Note that absolute values are meaningless, only their relative ratios matter.
gs = gridspec.GridSpec(2, 2,
                       width_ratios=[1,2],
                       height_ratios=[4,1]
                       )

ax1 = plt.subplot(gs[0])
ax2 = plt.subplot(gs[1])
ax3 = plt.subplot(gs[2])
ax4 = plt.subplot(gs[3])
(Source code, png, hires.png, pdf)