

(Source code, png, hires.png, pdf)
"""
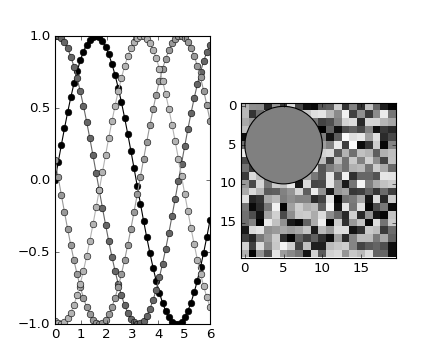
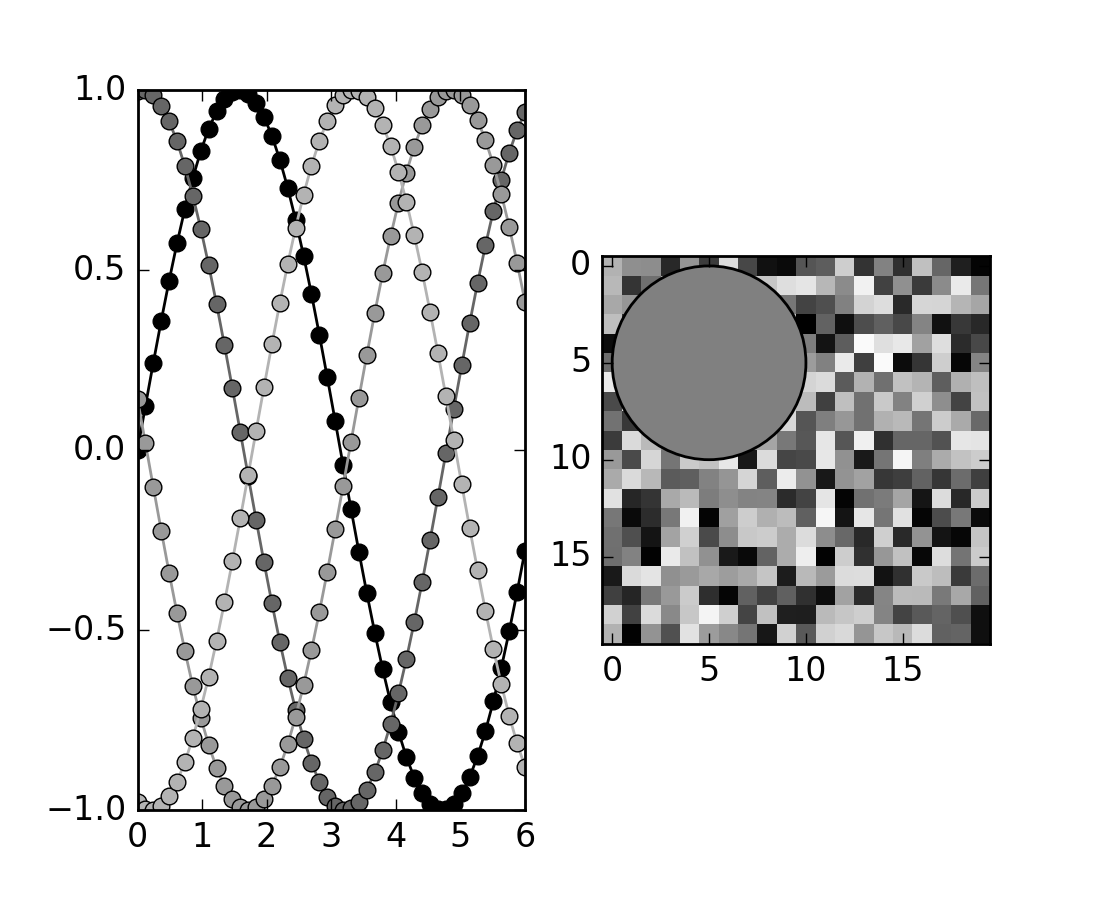
This example demonstrates the "grayscale" style sheet, which changes all colors
that are defined as rc parameters to grayscale. Note, however, that not all
plot elements default to colors defined by an rc parameter.
"""
import numpy as np
import matplotlib.pyplot as plt
def color_cycle_example(ax):
L = 6
x = np.linspace(0, L)
ncolors = len(plt.rcParams['axes.color_cycle'])
shift = np.linspace(0, L, ncolors, endpoint=False)
for s in shift:
ax.plot(x, np.sin(x + s), 'o-')
def image_and_patch_example(ax):
ax.imshow(np.random.random(size=(20, 20)), interpolation='none')
c = plt.Circle((5, 5), radius=5, label='patch')
ax.add_patch(c)
plt.style.use('grayscale')
fig, (ax1, ax2) = plt.subplots(ncols=2)
color_cycle_example(ax1)
image_and_patch_example(ax2)
plt.show()
Keywords: python, matplotlib, pylab, example, codex (see Search examples)