

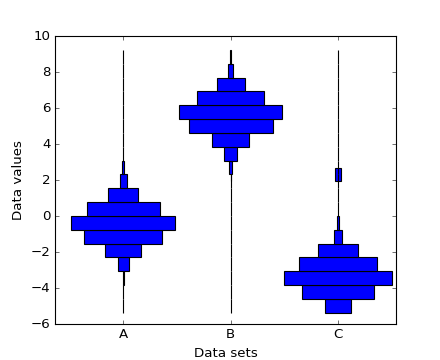
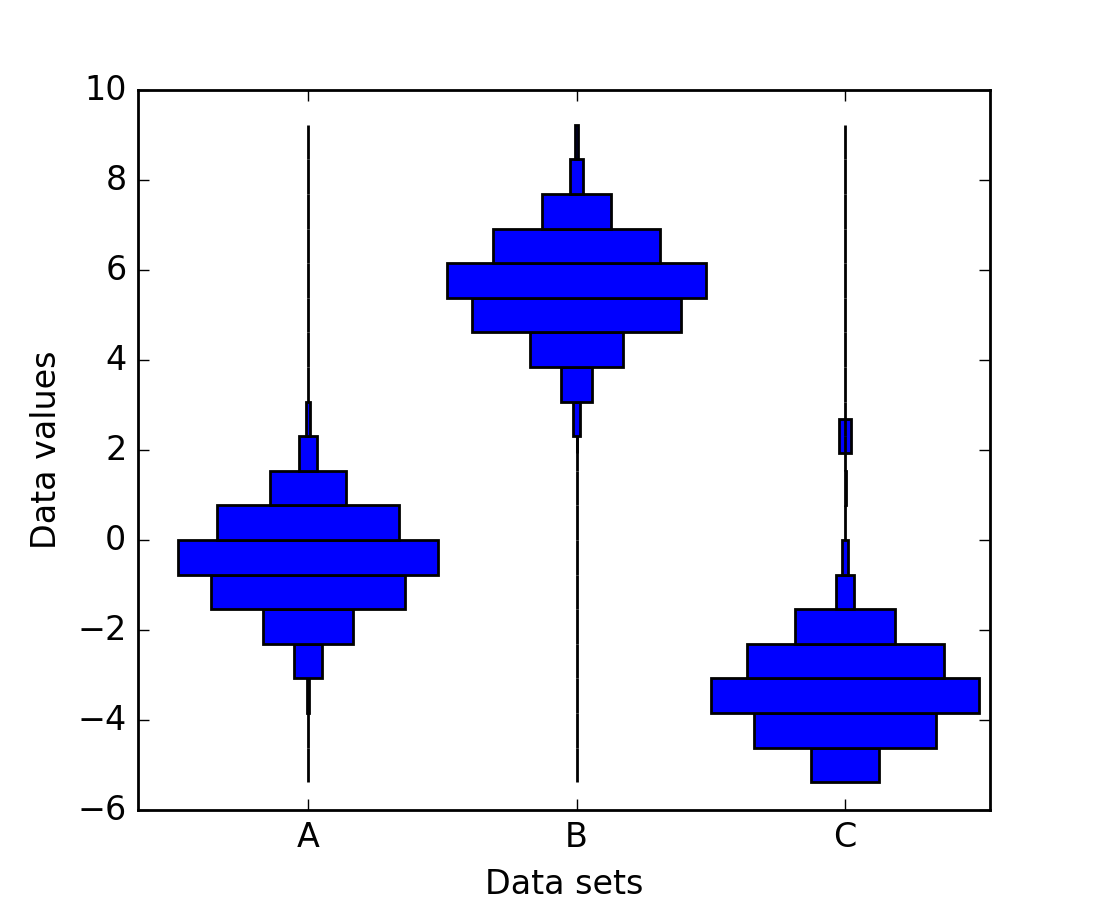
(Source code, png, hires.png, pdf)
"""
Demo of how to produce multiple histograms side by side
"""

import numpy as np
import matplotlib.pyplot as plt

number_of_bins = 20

# An example of three data sets to compare
number_of_data_points = 1000
labels = ["A", "B", "C"]
data_sets = [np.random.normal(0, 1, number_of_data_points),
             np.random.normal(6, 1, number_of_data_points),
             np.random.normal(-3, 1, number_of_data_points)]

# Computed quantities to aid plotting
hist_range = (np.min(data_sets), np.max(data_sets))
binned_data_sets = [np.histogram(d, range=hist_range, bins=number_of_bins)[0]
                    for d in data_sets]
binned_maximums = np.max(binned_data_sets, axis=1)
x_locations = np.arange(0, sum(binned_maximums), np.max(binned_maximums))

# The bin_edges are the same for all of the histograms
bin_edges = np.linspace(hist_range[0], hist_range[1], number_of_bins + 1)
centers = .5 * (bin_edges + np.roll(bin_edges, 1))[:-1]
heights = np.diff(bin_edges)

# Cycle through and plot each histogram
ax = plt.subplot(111)
for x_loc, binned_data in zip(x_locations, binned_data_sets):
    lefts = x_loc - .5 * binned_data
    ax.barh(centers, binned_data, height=heights, left=lefts)

ax.set_xticks(x_locations)
ax.set_xticklabels(labels)

ax.set_ylabel("Data values")
ax.set_xlabel("Data sets")

plt.show()
Keywords: python, matplotlib, pylab, example, codex (see Search examples)