

(Source code, png, hires.png, pdf)
import matplotlib.pyplot as plt
import numpy as np
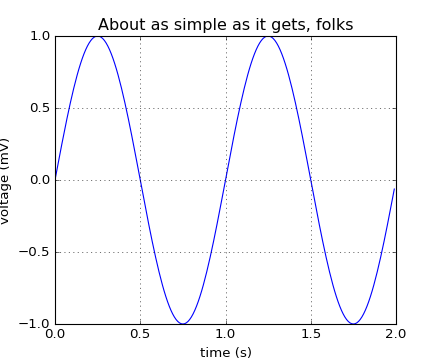
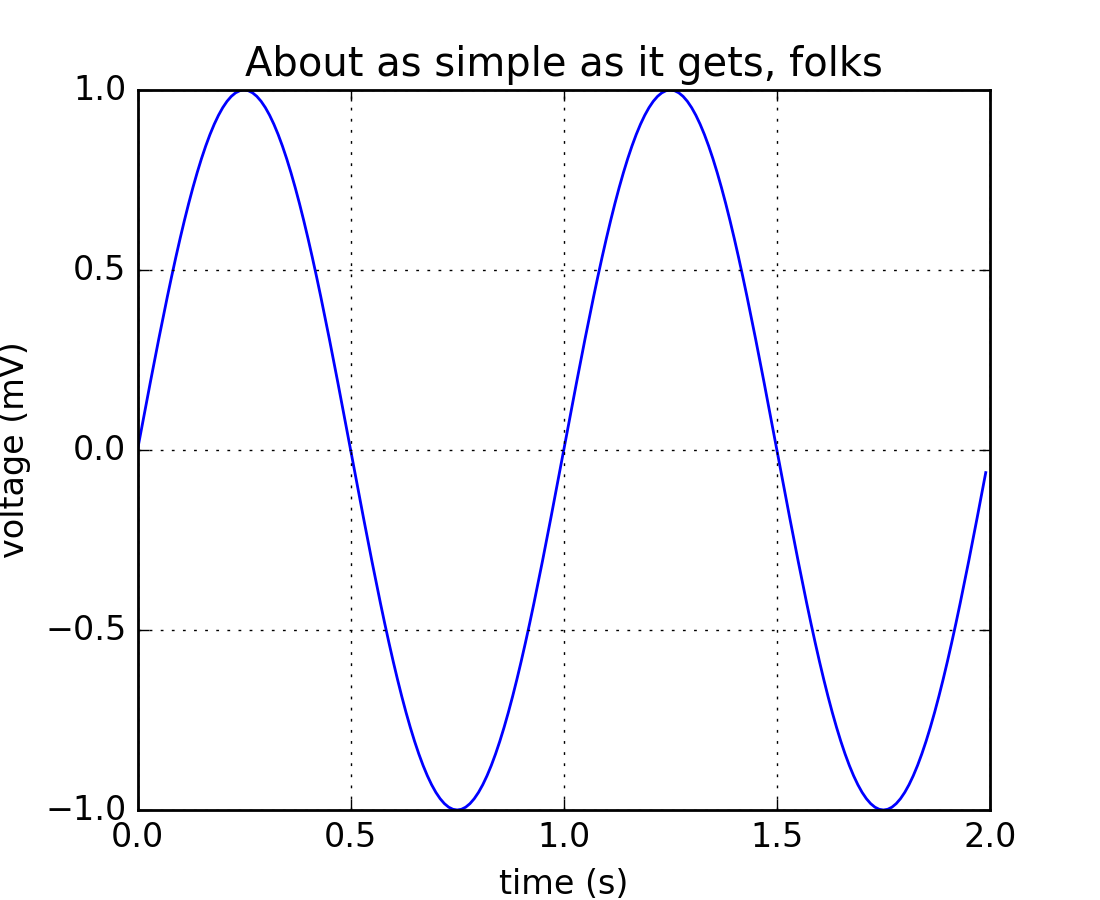
t = np.arange(0.0, 2.0, 0.01)
s = np.sin(2*np.pi*t)
plt.plot(t, s)
plt.xlabel('time (s)')
plt.ylabel('voltage (mV)')
plt.title('About as simple as it gets, folks')
plt.grid(True)
plt.savefig("test.png")
plt.show()
Keywords: python, matplotlib, pylab, example, codex (see Search examples)