

(Source code, png, hires.png, pdf)
"""
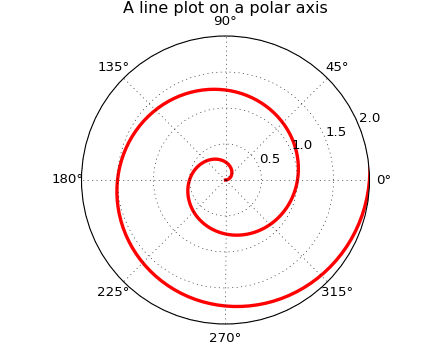
Demo of a line plot on a polar axis.
"""
import numpy as np
import matplotlib.pyplot as plt
r = np.arange(0, 3.0, 0.01)
theta = 2 * np.pi * r
ax = plt.subplot(111, projection='polar')
ax.plot(theta, r, color='r', linewidth=3)
ax.set_rmax(2.0)
ax.grid(True)
ax.set_title("A line plot on a polar axis", va='bottom')
plt.show()
Keywords: python, matplotlib, pylab, example, codex (see Search examples)