

(Source code, png, hires.png, pdf)

import matplotlib.pyplot as plt
from matplotlib.colors import LogNorm
import numpy as np
from matplotlib.mlab import bivariate_normal
N = 100
X, Y = np.mgrid[-3:3:complex(0, N), -2:2:complex(0, N)]
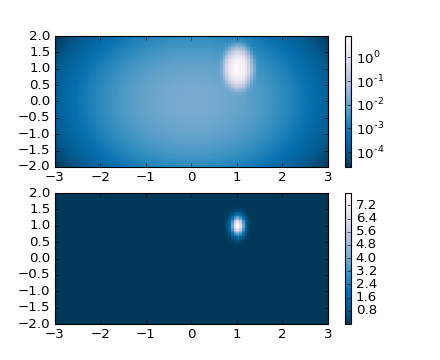
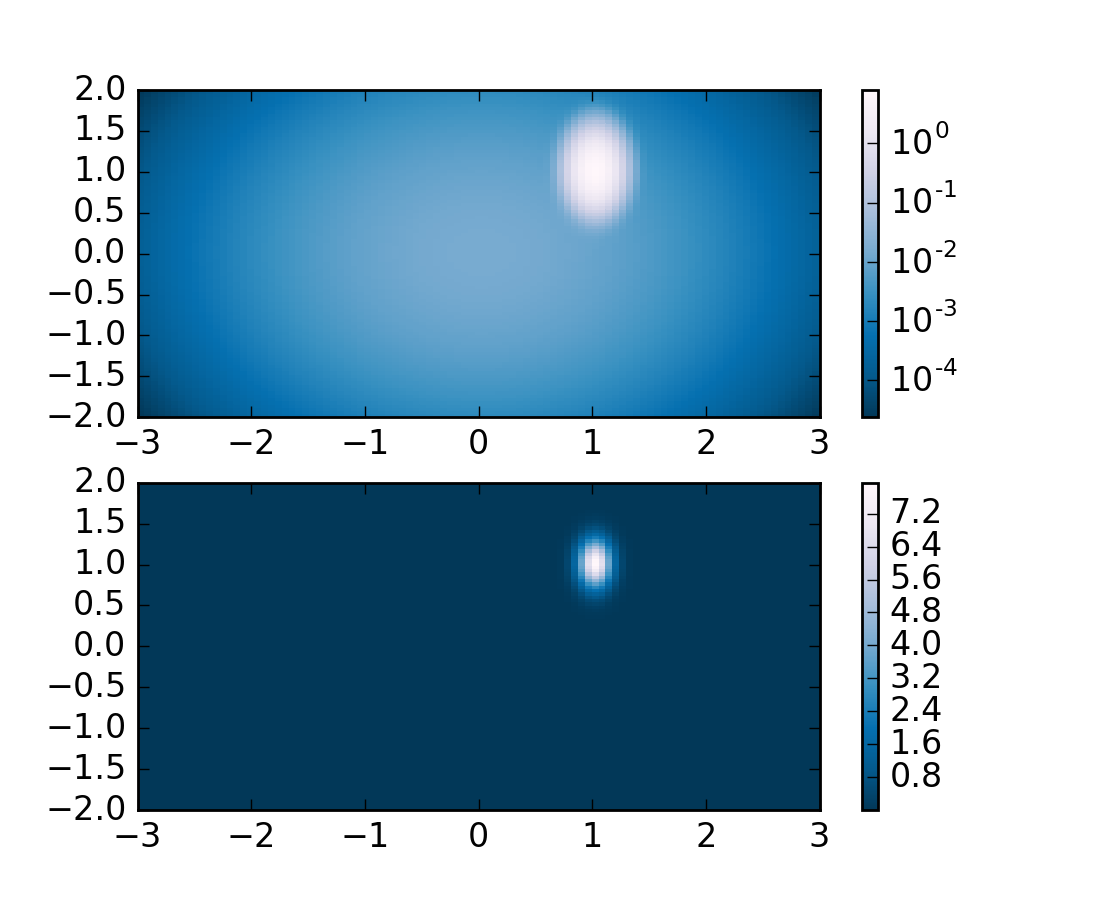
# A low hump with a spike coming out of the top right.
# Needs to have z/colour axis on a log scale so we see both hump and spike.
# linear scale only shows the spike.
Z1 = bivariate_normal(X, Y, 0.1, 0.2, 1.0, 1.0) + 0.1 * bivariate_normal(X, Y, 1.0, 1.0, 0.0, 0.0)
plt.subplot(2, 1, 1)
plt.pcolor(X, Y, Z1, norm=LogNorm(vmin=Z1.min(), vmax=Z1.max()), cmap='PuBu_r')
plt.colorbar()
plt.subplot(2, 1, 2)
plt.pcolor(X, Y, Z1, cmap='PuBu_r')
plt.colorbar()
plt.show()
Keywords: python, matplotlib, pylab, example, codex (see Search examples)