

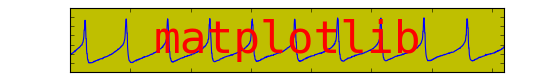
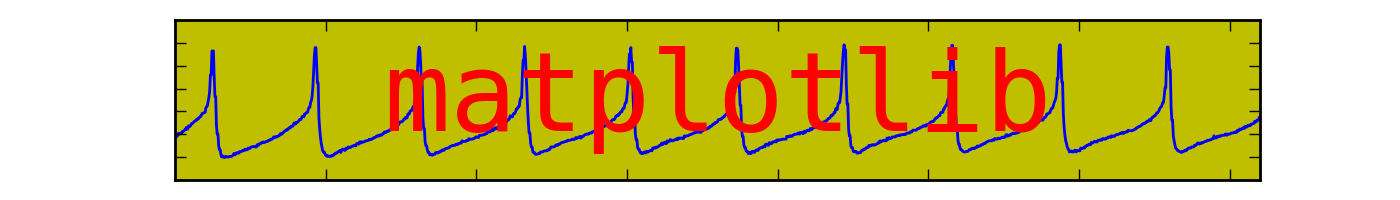
(Source code, png, hires.png, pdf)
# This file generates an old version of the matplotlib logo

from __future__ import print_function
# Above import not necessary for Python 3 onwards. Recommend taking this
# out in examples in the future, since we should all move to Python 3.
import matplotlib.pyplot as plt
import numpy as np
import matplotlib.cbook as cbook

# convert data to mV
datafile = cbook.get_sample_data('membrane.dat', asfileobj=False)
print('loading', datafile)

x = 1000 * 0.1 * np.fromstring(open(datafile, 'rb').read(), np.float32)
# 0.0005 is the sample interval
t = 0.0005 * np.arange(len(x))
plt.figure(1, figsize=(7, 1), dpi=100)
ax = plt.subplot(111, axisbg='y')
plt.plot(t, x)
plt.text(0.5, 0.5, 'matplotlib', color='r',
         fontsize=40, fontname=['Courier', 'Bitstream Vera Sans Mono'],
         horizontalalignment='center',
         verticalalignment='center',
         transform=ax.transAxes,
         )
plt.axis([1, 1.72, -60, 10])
plt.gca().set_xticklabels([])
plt.gca().set_yticklabels([])

plt.show()
Keywords: python, matplotlib, pylab, example, codex (see Search examples)