

(Source code, png, hires.png, pdf)

import matplotlib.pyplot as plt
import numpy as np
from matplotlib.collections import LineCollection
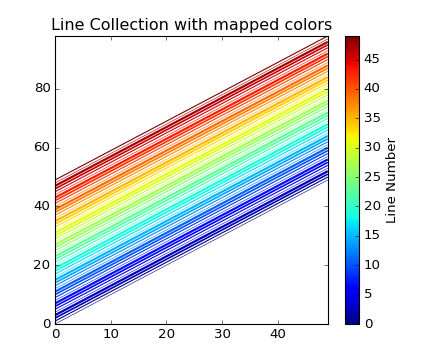
# In order to efficiently plot many lines in a single set of axes,
# Matplotlib has the ability to add the lines all at once. Here is a
# simple example showing how it is done.
N = 50
x = np.arange(N)
# Here are many sets of y to plot vs x
ys = [x + i for i in x]
# We need to set the plot limits, they will not autoscale
ax = plt.axes()
ax.set_xlim((np.amin(x), np.amax(x)))
ax.set_ylim((np.amin(np.amin(ys)), np.amax(np.amax(ys))))
# colors is sequence of rgba tuples
# linestyle is a string or dash tuple. Legal string values are
# solid|dashed|dashdot|dotted. The dash tuple is (offset, onoffseq)
# where onoffseq is an even length tuple of on and off ink in points.
# If linestyle is omitted, 'solid' is used
# See matplotlib.collections.LineCollection for more information
# Make a sequence of x,y pairs
line_segments = LineCollection([list(zip(x, y)) for y in ys],
linewidths=(0.5, 1, 1.5, 2),
linestyles='solid')
line_segments.set_array(x)
ax.add_collection(line_segments)
fig = plt.gcf()
axcb = fig.colorbar(line_segments)
axcb.set_label('Line Number')
ax.set_title('Line Collection with mapped colors')
plt.sci(line_segments) # This allows interactive changing of the colormap.
plt.show()
Keywords: python, matplotlib, pylab, example, codex (see Search examples)