

(Source code, png, hires.png, pdf)

"""
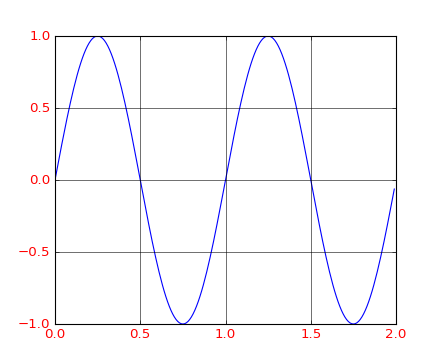
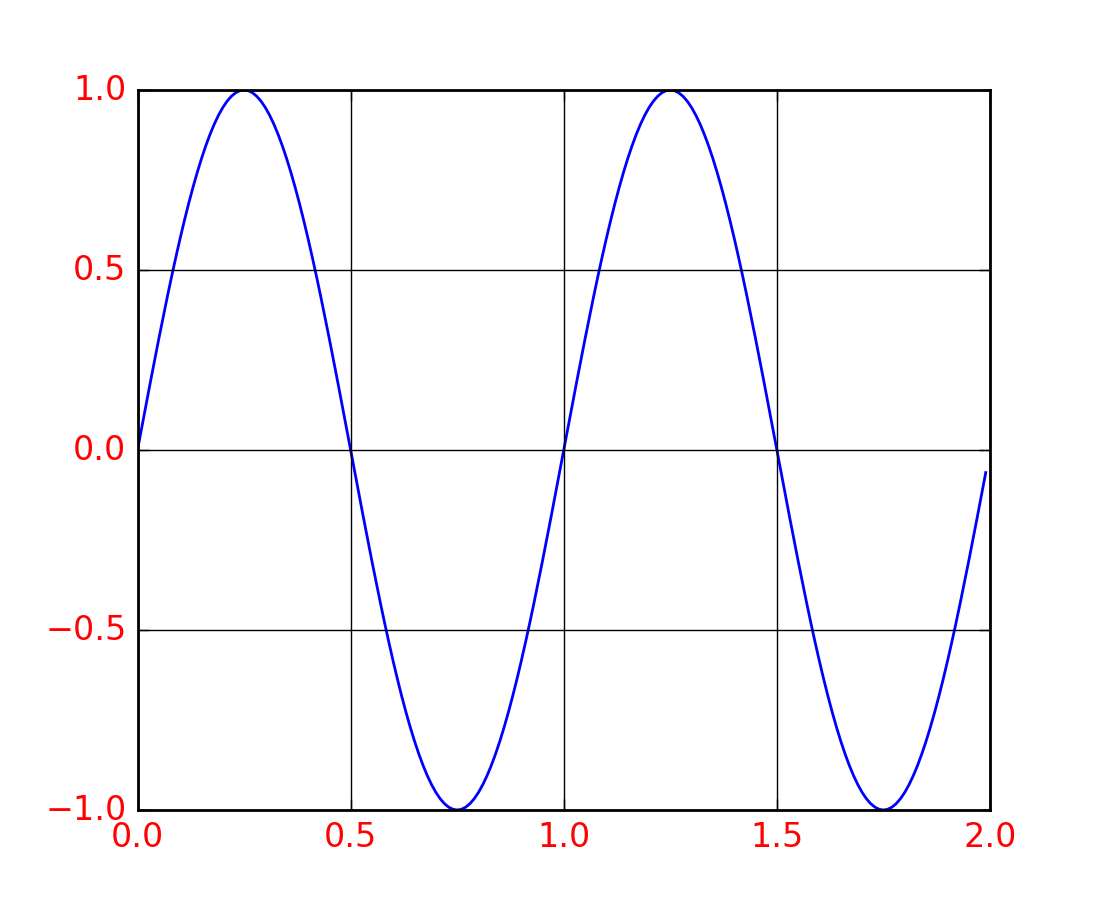
You can control the axis tick and grid properties
"""
import matplotlib.pyplot as plt
import numpy as np
t = np.arange(0.0, 2.0, 0.01)
s = np.sin(2 * np.pi * t)
fig, ax = plt.subplots()
ax.plot(t, s)
ax.grid(True)
ticklines = ax.get_xticklines() + ax.get_yticklines()
gridlines = ax.get_xgridlines() + ax.get_ygridlines()
ticklabels = ax.get_xticklabels() + ax.get_yticklabels()
for line in ticklines:
line.set_linewidth(3)
for line in gridlines:
line.set_linestyle('-')
for label in ticklabels:
label.set_color('r')
label.set_fontsize('medium')
plt.show()
Keywords: python, matplotlib, pylab, example, codex (see Search examples)