

(Source code, png, hires.png, pdf)

import matplotlib.pyplot as plt
import numpy as np
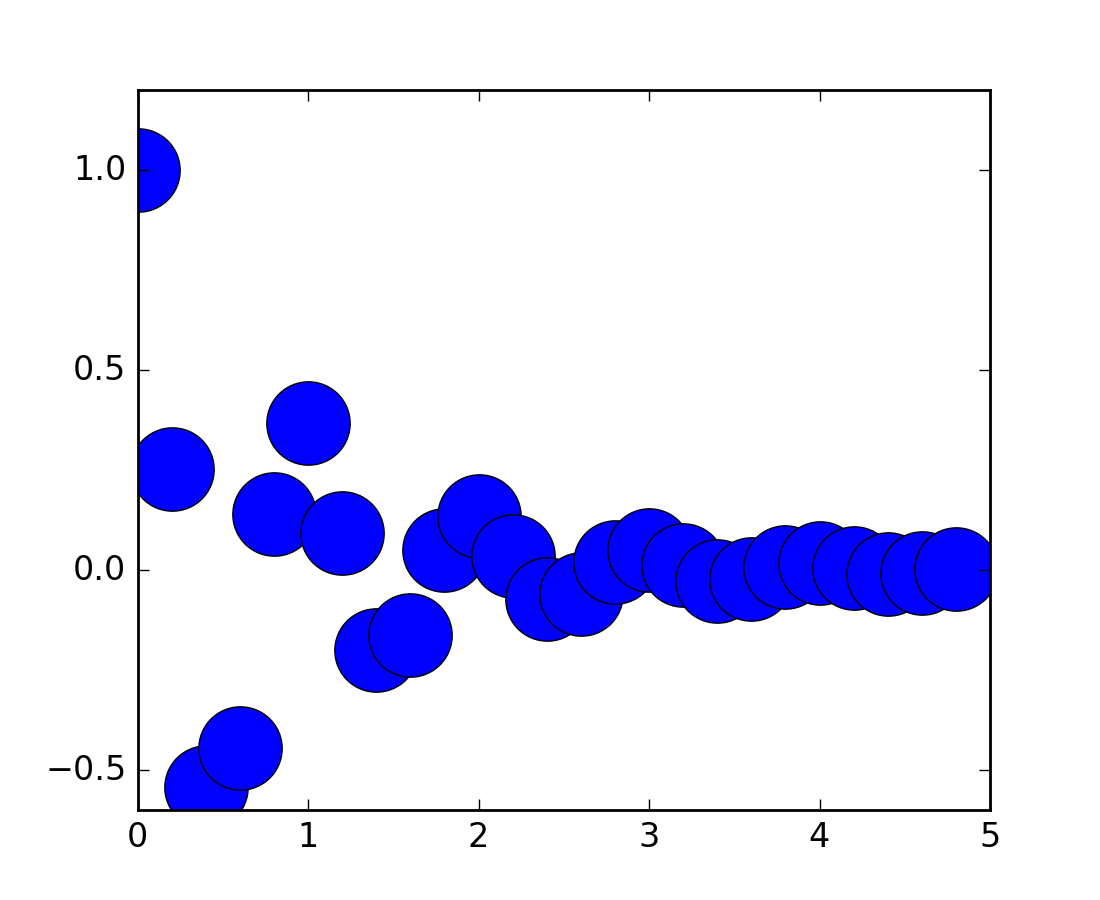
def f(t):
'a damped exponential'
s1 = np.cos(2 * np.pi * t)
e1 = np.exp(-t)
return s1 * e1
t1 = np.arange(0.0, 5.0, .2)
l = plt.plot(t1, f(t1), 'ro')
plt.setp(l, 'markersize', 30)
plt.setp(l, 'markerfacecolor', 'b')
plt.show()
Keywords: python, matplotlib, pylab, example, codex (see Search examples)