

(Source code, png, hires.png, pdf)

import matplotlib.pyplot as plt
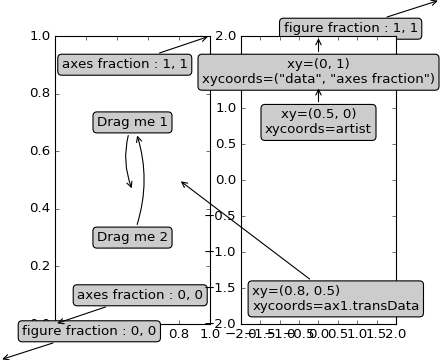
fig, (ax1, ax2) = plt.subplots(1, 2)
bbox_args = dict(boxstyle="round", fc="0.8")
arrow_args = dict(arrowstyle="->")
ax1.annotate('figure fraction : 0, 0', xy=(0, 0), xycoords='figure fraction',
xytext=(20, 20), textcoords='offset points',
ha="left", va="bottom",
bbox=bbox_args,
arrowprops=arrow_args
)
ax1.annotate('figure fraction : 1, 1', xy=(1, 1), xycoords='figure fraction',
xytext=(-20, -20), textcoords='offset points',
ha="right", va="top",
bbox=bbox_args,
arrowprops=arrow_args
)
ax1.annotate('axes fraction : 0, 0', xy=(0, 0), xycoords='axes fraction',
xytext=(20, 20), textcoords='offset points',
ha="left", va="bottom",
bbox=bbox_args,
arrowprops=arrow_args
)
ax1.annotate('axes fraction : 1, 1', xy=(1, 1), xycoords='axes fraction',
xytext=(-20, -20), textcoords='offset points',
ha="right", va="top",
bbox=bbox_args,
arrowprops=arrow_args
)
an1 = ax1.annotate('Drag me 1', xy=(.5, .7), xycoords='data',
#xytext=(.5, .7), textcoords='data',
ha="center", va="center",
bbox=bbox_args,
#arrowprops=arrow_args
)
an2 = ax1.annotate('Drag me 2', xy=(.5, .5), xycoords=an1,
xytext=(.5, .3), textcoords='axes fraction',
ha="center", va="center",
bbox=bbox_args,
arrowprops=dict(patchB=an1.get_bbox_patch(),
connectionstyle="arc3,rad=0.2",
**arrow_args)
)
an3 = ax1.annotate('', xy=(.5, .5), xycoords=an2,
xytext=(.5, .5), textcoords=an1,
ha="center", va="center",
bbox=bbox_args,
arrowprops=dict(patchA=an1.get_bbox_patch(),
patchB=an2.get_bbox_patch(),
connectionstyle="arc3,rad=0.2",
**arrow_args)
)
t = ax2.annotate('xy=(0, 1)\nxycoords=("data", "axes fraction")',
xy=(0, 1), xycoords=("data", 'axes fraction'),
xytext=(0, -20), textcoords='offset points',
ha="center", va="top",
bbox=bbox_args,
arrowprops=arrow_args
)
from matplotlib.text import OffsetFrom
ax2.annotate('xy=(0.5, 0)\nxycoords=artist',
xy=(0.5, 0.), xycoords=t,
xytext=(0, -20), textcoords='offset points',
ha="center", va="top",
bbox=bbox_args,
arrowprops=arrow_args
)
ax2.annotate('xy=(0.8, 0.5)\nxycoords=ax1.transData',
xy=(0.8, 0.5), xycoords=ax1.transData,
xytext=(10, 10), textcoords=OffsetFrom(ax2.bbox, (0, 0), "points"),
ha="left", va="bottom",
bbox=bbox_args,
arrowprops=arrow_args
)
ax2.set_xlim(-2, 2)
ax2.set_ylim(-2, 2)
an1.draggable()
an2.draggable()
plt.show()
Keywords: python, matplotlib, pylab, example, codex (see Search examples)