

"""
Reference for filled- and unfilled-marker types included with Matplotlib.
"""
from six import iteritems
import numpy as np
import matplotlib.pyplot as plt
from matplotlib.lines import Line2D
points = np.ones(3) # Draw 3 points for each line
text_style = dict(horizontalalignment='right', verticalalignment='center',
fontsize=12, fontdict={'family': 'monospace'})
marker_style = dict(linestyle=':', color='cornflowerblue', markersize=10)
def format_axes(ax):
ax.margins(0.2)
ax.set_axis_off()
def nice_repr(text):
return repr(text).lstrip('u')
def split_list(a_list):
i_half = len(a_list) // 2
return (a_list[:i_half], a_list[i_half:])
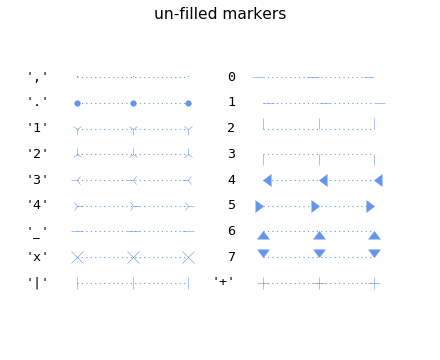
# Plot all un-filled markers
# --------------------------
fig, axes = plt.subplots(ncols=2)
# Filter out filled markers and marker settings that do nothing.
# We use iteritems from six to make sure that we get an iterator
# in both python 2 and 3
unfilled_markers = [m for m, func in iteritems(Line2D.markers)
if func != 'nothing' and m not in Line2D.filled_markers]
# Reverse-sort for pretty. We use our own sort key which is essentially
# a python3 compatible reimplementation of python2 sort.
unfilled_markers = sorted(unfilled_markers,
key=lambda x: (str(type(x)), str(x)))[::-1]
for ax, markers in zip(axes, split_list(unfilled_markers)):
for y, marker in enumerate(markers):
ax.text(-0.5, y, nice_repr(marker), **text_style)
ax.plot(y * points, marker=marker, **marker_style)
format_axes(ax)
fig.suptitle('un-filled markers', fontsize=14)
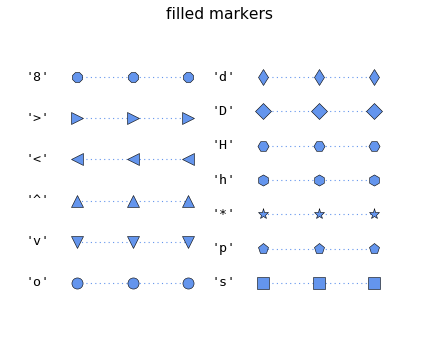
# Plot all filled markers.
# ------------------------
fig, axes = plt.subplots(ncols=2)
for ax, markers in zip(axes, split_list(Line2D.filled_markers)):
for y, marker in enumerate(markers):
ax.text(-0.5, y, nice_repr(marker), **text_style)
ax.plot(y * points, marker=marker, **marker_style)
format_axes(ax)
fig.suptitle('filled markers', fontsize=14)
plt.show()
Keywords: python, matplotlib, pylab, example, codex (see Search examples)
