

(Source code, png, hires.png, pdf)

"""
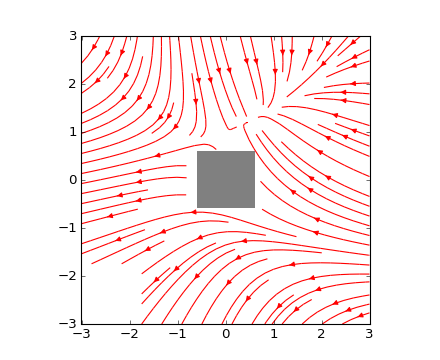
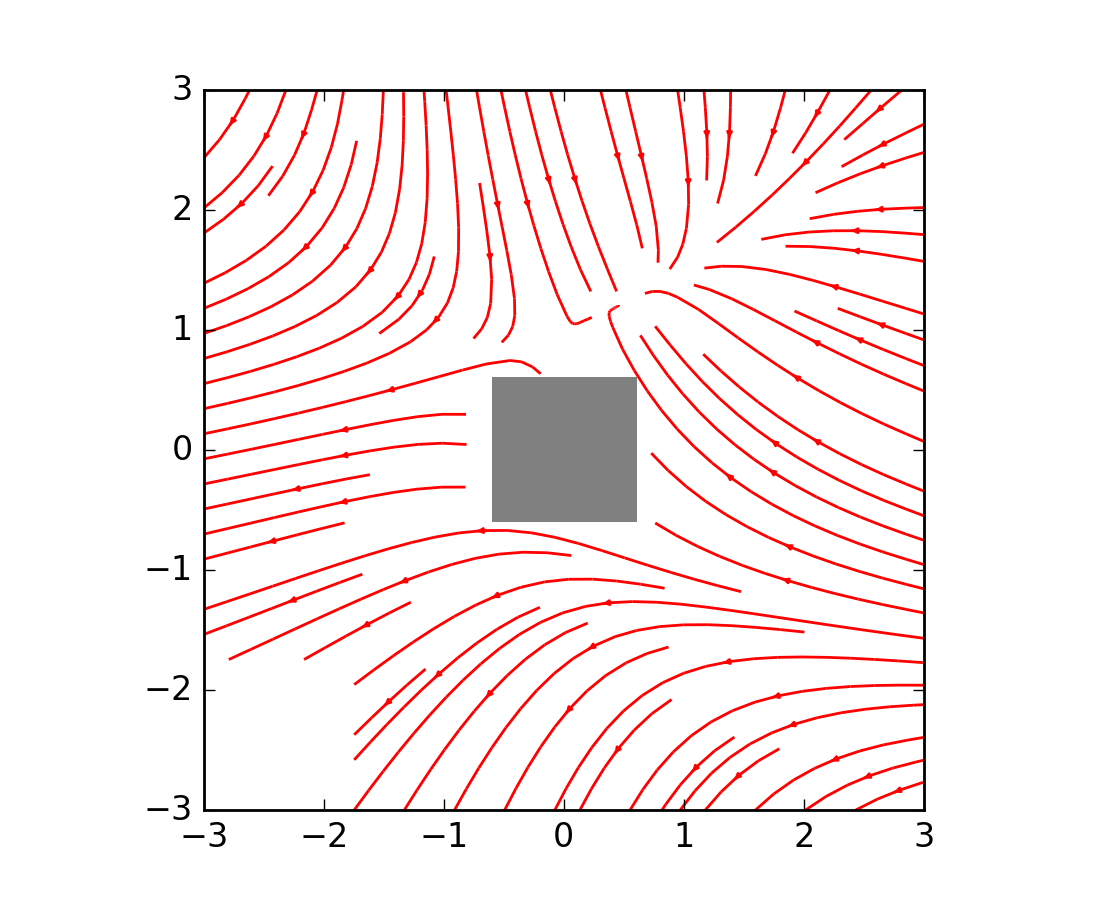
Demo of the streamplot function with masking.
This example shows how streamlines created by the streamplot function skips
masked regions and NaN values.
"""
import numpy as np
import matplotlib.pyplot as plt
w = 3
Y, X = np.mgrid[-w:w:100j, -w:w:100j]
U = -1 - X**2 + Y
V = 1 + X - Y**2
speed = np.sqrt(U*U + V*V)
mask = np.zeros(U.shape, dtype=bool)
mask[40:60, 40:60] = 1
U = np.ma.array(U, mask=mask)
U[:20, :20] = np.nan
plt.streamplot(X, Y, U, V, color='r')
plt.imshow(~mask, extent=(-w, w, -w, w), alpha=0.5,
interpolation='nearest', cmap=plt.cm.gray)
plt.show()
Keywords: python, matplotlib, pylab, example, codex (see Search examples)