

(Source code, png, hires.png, pdf)
#!/usr/bin/env python
"""
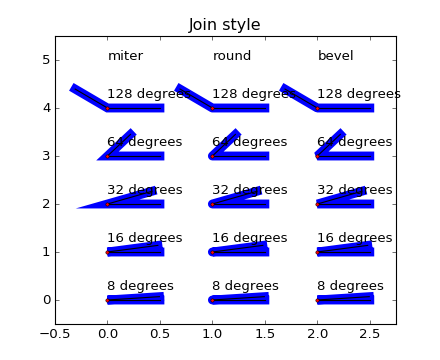
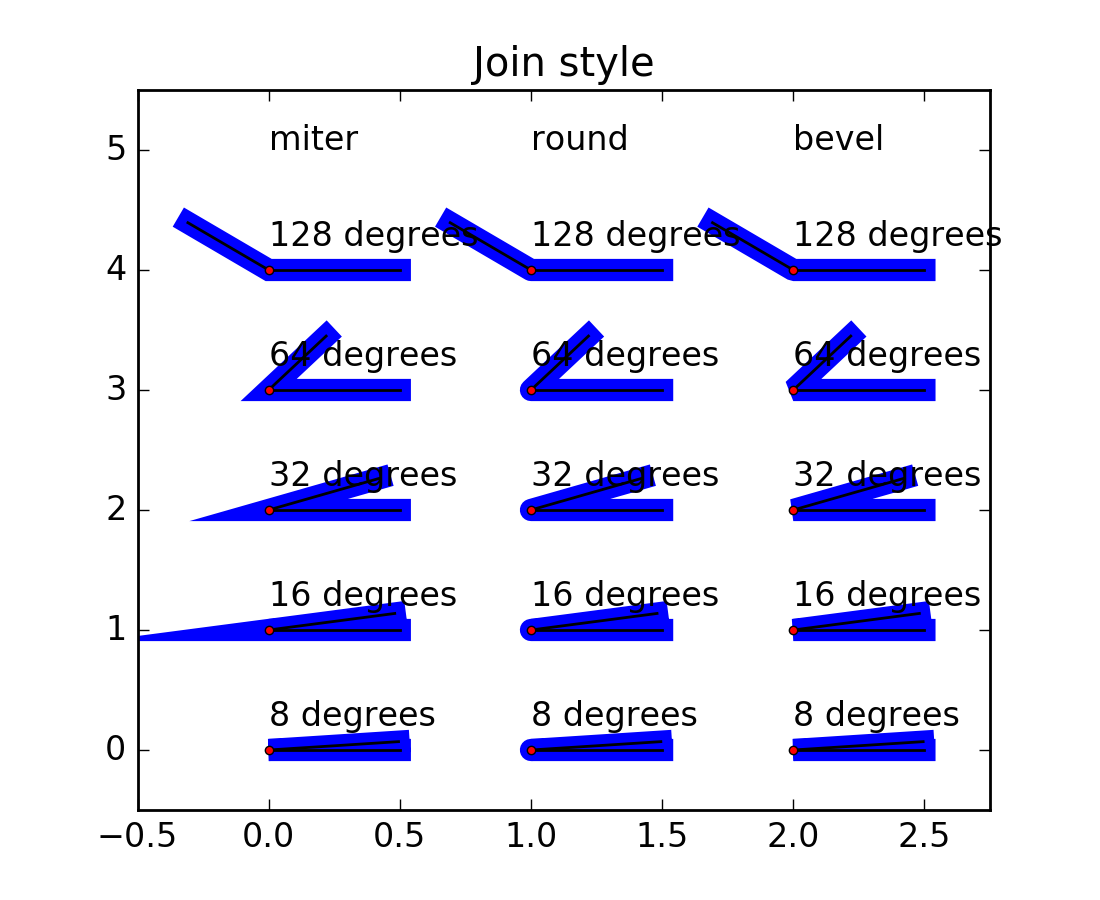
Illustrate the three different join styles
"""
import numpy as np
import matplotlib.pyplot as plt
def plot_angle(ax, x, y, angle, style):
phi = np.radians(angle)
xx = [x + .5, x, x + .5*np.cos(phi)]
yy = [y, y, y + .5*np.sin(phi)]
ax.plot(xx, yy, lw=8, color='blue', solid_joinstyle=style)
ax.plot(xx[1:], yy[1:], lw=1, color='black')
ax.plot(xx[1::-1], yy[1::-1], lw=1, color='black')
ax.plot(xx[1:2], yy[1:2], 'o', color='red', markersize=3)
ax.text(x, y + .2, '%.0f degrees' % angle)
fig, ax = plt.subplots()
ax.set_title('Join style')
for x, style in enumerate((('miter', 'round', 'bevel'))):
ax.text(x, 5, style)
for i in range(5):
plot_angle(ax, x, i, pow(2.0, 3 + i), style)
ax.set_xlim(-.5, 2.75)
ax.set_ylim(-.5, 5.5)
plt.show()
Keywords: python, matplotlib, pylab, example, codex (see Search examples)