
The documentation for matplotlib is generated from ReStructured Text using the Sphinx documentation generation tool. Sphinx-1.0 or later and numpydoc 0.4 or later is required.
The documentation sources are found in the doc/ directory in
the trunk. To build the users guide in html format, cd into
doc/ and do:
python make.py html
or:
./make.py html
you can also pass a latex flag to make.py to build a pdf, or pass no
arguments to build everything.
The output produced by Sphinx can be configured by editing the conf.py
file located in the doc/.
The actual ReStructured Text files are kept in doc/users,
doc/devel, doc/api and doc/faq. The main entry point is
doc/index.rst, which pulls in the index.rst file for the users
guide, developers guide, api reference, and faqs. The documentation suite is
built as a single document in order to make the most effective use of cross
referencing, we want to make navigating the Matplotlib documentation as easy as
possible.
Additional files can be added to the various guides by including their base file name (the .rst extension is not necessary) in the table of contents. It is also possible to include other documents through the use of an include statement, such as:
.. include:: ../../TODO
In addition to the “narrative” documentation described above, matplotlib also defines its API reference documentation in docstrings. For the most part, these are standard Python docstrings, but matplotlib also includes some features to better support documenting getters and setters.
Matplotlib uses artist introspection of docstrings to support
properties. All properties that you want to support through setp
and getp should have a set_property and get_property
method in the Artist class. Yes, this is
not ideal given python properties or enthought traits, but it is a
historical legacy for now. The setter methods use the docstring with
the ACCEPTS token to indicate the type of argument the method accepts.
e.g., in matplotlib.lines.Line2D:
# in lines.py
def set_linestyle(self, linestyle):
    """
    Set the linestyle of the line

    ACCEPTS: [ '-' | '--' | '-.' | ':' | 'steps' | 'None' | ' ' | '' ]
    """
Since matplotlib uses a lot of pass-through kwargs, e.g., in every
function that creates a line (plot(),
semilogx(),
semilogy(), etc...), it can be difficult for
the new user to know which kwargs are supported. Matplotlib uses
a docstring interpolation scheme to support documentation of every
function that takes a **kwargs. The requirements are:
The function matplotlib.artist.kwdoc() and the decorator
matplotlib.docstring.dedent_interpd() facilitate this. They combine
python string interpolation in the docstring with the matplotlib
artist introspection facility that underlies setp and getp.
The kwdoc function gives the list of properties as a docstring. In order
to use this in another docstring, first update the
matplotlib.docstring.interpd object, as seen in this example from
matplotlib.lines:
# in lines.py
docstring.interpd.update(Line2D=artist.kwdoc(Line2D))
Then in any function accepting Line2D
pass-through kwargs, e.g., matplotlib.axes.Axes.plot():
# in axes.py
@docstring.dedent_interpd
def plot(self, *args, **kwargs):
    """
    Some stuff omitted

    The kwargs are Line2D properties:
    %(Line2D)s

    kwargs scalex and scaley, if defined, are passed on
    to autoscale_view to determine whether the x and y axes are
    autoscaled; default True.  See Axes.autoscale_view for more
    information
    """
    pass
Note there is a problem for Artist
__init__ methods, e.g., matplotlib.patches.Patch.__init__(),
which supports Patch kwargs, since the artist inspector cannot
work until the class is fully defined and we can’t modify the
Patch.__init__.__doc__ docstring outside the class definition.
There are some some manual hacks in this case, violating the
“single entry point” requirement above – see the
docstring.interpd.update calls in matplotlib.patches.
The Sphinx website contains plenty of documentation concerning ReST markup and working with Sphinx in general. Here are a few additional things to keep in mind:
Please familiarize yourself with the Sphinx directives for inline
markup. Matplotlib’s documentation makes heavy use of cross-referencing and
other semantic markup. For example, when referring to external files, use the
:file: directive.
Function arguments and keywords should be referred to using the emphasis role. This will keep matplotlib’s documentation consistent with Python’s documentation:
Here is a description of *argument*
Please do not use the default role:
Please do not describe `argument` like this.
nor the literal role:
Please do not describe ``argument`` like this.
Sphinx does not support tables with column- or row-spanning cells for latex output. Such tables can not be used when documenting matplotlib.
Mathematical expressions can be rendered as png images in html, and in the usual way by latex. For example:
:math:`\sin(x_n^2)` yields:  , and:
.. math::

  \int_{-\infty}^{\infty}\frac{e^{i\phi}}{1+x^2\frac{e^{i\phi}}{1+x^2}}
yields:

Interactive IPython sessions can be illustrated in the documentation using the following directive:
.. sourcecode:: ipython

  In [69]: lines = plot([1,2,3])
which would yield:
In [69]: lines = plot([1,2,3])
Footnotes [1] can be added using [#]_, followed later by:
.. rubric:: Footnotes

.. [#]
Footnotes
| [1] | For example. |
Use the note and warning directives, sparingly, to draw attention to important comments:
.. note::
   Here is a note
yields:
Note
here is a note
also:
Warning
here is a warning
Use the deprecated directive when appropriate:
.. deprecated:: 0.98
   This feature is obsolete, use something else.
yields:
Deprecated since version 0.98: This feature is obsolete, use something else.
Use the versionadded and versionchanged directives, which have similar syntax to the deprecated role:
.. versionadded:: 0.98
   The transforms have been completely revamped.
New in version 0.98: The transforms have been completely revamped.
Use the seealso directive, for example:
.. seealso::

   Using ReST :ref:`emacs-helpers`:
      One example

   A bit about :ref:`referring-to-mpl-docs`:
      One more
yields:
See also
One example
One more
Please keep the Glossary in mind when writing documentation. You can
create a references to a term in the glossary with the :term: role.
The autodoc extension will handle index entries for the API, but additional entries in the index need to be explicitly added.
Please limit the text width of docstrings to 70 characters.
Keyword arguments should be described using a definition list.
Note
matplotlib makes extensive use of keyword arguments as pass-through arguments, there are a many cases where a table is used in place of a definition list for autogenerated sections of docstrings.
Figures can be automatically generated from scripts and included in the docs. It is not necessary to explicitly save the figure in the script, this will be done automatically at build time to ensure that the code that is included runs and produces the advertised figure.
The path should be relative to the doc directory. Any plots
specific to the documentation should be added to the doc/pyplots
directory and committed to git. Plots from the examples directory
may be referenced through the symlink mpl_examples in the doc
directory. e.g.:
.. plot:: mpl_examples/pylab_examples/simple_plot.py
The :scale: directive rescales the image to some percentage of the
original size, though we don’t recommend using this in most cases
since it is probably better to choose the correct figure size and dpi
in mpl and let it handle the scaling.
A directive for including a matplotlib plot in a Sphinx document.
By default, in HTML output, plot will include a .png file with a
link to a high-res .png and .pdf. In LaTeX output, it will include a
.pdf.
The source code for the plot may be included in one of three ways:
A path to a source file as the argument to the directive:
.. plot:: path/to/plot.pyWhen a path to a source file is given, the content of the directive may optionally contain a caption for the plot:
.. plot:: path/to/plot.py

   This is the caption for the plot
Additionally, one may specify the name of a function to call (with no arguments) immediately after importing the module:
.. plot:: path/to/plot.py plot_function1Included as inline content to the directive:
.. plot::

   import matplotlib.pyplot as plt
   import matplotlib.image as mpimg
   import numpy as np
   img = mpimg.imread('_static/stinkbug.png')
   imgplot = plt.imshow(img)
Using doctest syntax:
.. plot::
   A plotting example:
   >>> import matplotlib.pyplot as plt
   >>> plt.plot([1,2,3], [4,5,6])
The plot directive supports the following options:
- format
: {‘python’, ‘doctest’}- Specify the format of the input
- include-source
: bool- Whether to display the source code. The default can be changed using the
plot_include_sourcevariable in conf.py- encoding
: str- If this source file is in a non-UTF8 or non-ASCII encoding, the encoding must be specified using the
:encoding:option. The encoding will not be inferred using the-*- coding -*-metacomment.- context
: bool or str- If provided, the code will be run in the context of all previous plot directives for which the
:context:option was specified. This only applies to inline code plot directives, not those run from files. If the:context: resetoption is specified, the context is reset for this and future plots, and previous figures are closed prior to running the code.:context:close-figskeeps the context but closes previous figures before running the code.- nofigs
: bool- If specified, the code block will be run, but no figures will be inserted. This is usually useful with the
:context:option.
Additionally, this directive supports all of the options of the
image directive, except for target (since plot will add its own
target). These include alt, height, width, scale, align and
class.
The plot directive has the following configuration options:
- plot_include_source
- Default value for the include-source option
- plot_html_show_source_link
- Whether to show a link to the source in HTML.
- plot_pre_code
- Code that should be executed before each plot.
- plot_basedir
- Base directory, to which
plot::file names are relative to. (If None or empty, file names are relative to the directory where the file containing the directive is.)- plot_formats
File formats to generate. List of tuples or strings:
[(suffix, dpi), suffix, ...]that determine the file format and the DPI. For entries whose DPI was omitted, sensible defaults are chosen. When passing from the command line through sphinx_build the list should be passed as suffix:dpi,suffix:dpi, ....
- plot_html_show_formats
- Whether to show links to the files in HTML.
- plot_rcparams
- A dictionary containing any non-standard rcParams that should be applied before each plot.
- plot_apply_rcparams
- By default, rcParams are applied when
contextoption is not used in a plot directive. This configuration option overrides this behavior and applies rcParams before each plot.- plot_working_directory
- By default, the working directory will be changed to the directory of the example, so the code can get at its data files, if any. Also its path will be added to
sys.pathso it can import any helper modules sitting beside it. This configuration option can be used to specify a central directory (also added tosys.path) where data files and helper modules for all code are located.- plot_template
- Provide a customized template for preparing restructured text.
Any figures that rely on optional system configurations need to be handled a
little differently. These figures are not to be generated during the
documentation build, in order to keep the prerequisites to the documentation
effort as low as possible. Please run the doc/pyplots/make.py script
when adding such figures, and commit the script and the images to
git. Please also add a line to the README in doc/pyplots for any additional
requirements necessary to generate a new figure. Once these steps have been
taken, these figures can be included in the usual way:
.. plot:: pyplots/tex_unicode_demo.py
   :include-source:
The source of the files in the examples directory are
automatically included in the HTML docs. An image is generated and
included for all examples in the api and pylab_examples
directories. To exclude the example from having an image rendered,
insert the following special comment anywhere in the script:
# -*- noplot -*-
We have a matplotlib google/gmail account with username mplgithub
which we used to setup the github account but can be used for other
purposes, like hosting google docs or youtube videos. You can embed a
matplotlib animation in the docs by first saving the animation as a
movie using matplotlib.animation.Animation.save(), and then
uploading to matplotlib’s youtube
channel and inserting the
embedding string youtube provides like:
.. raw:: html

   <iframe width="420" height="315"
     src="http://www.youtube.com/embed/32cjc6V0OZY"
     frameborder="0" allowfullscreen>
   </iframe>
An example save command to generate a movie looks like this
ani = animation.FuncAnimation(fig, animate, np.arange(1, len(y)),
    interval=25, blit=True, init_func=init)

ani.save('double_pendulum.mp4', fps=15)
Contact Michael Droettboom for the login password to upload youtube videos of google docs to the mplgithub account.
In the documentation, you may want to include to a document in the
matplotlib src, e.g., a license file or an image file from mpl-data,
refer to it via a relative path from the document where the rst file
resides, e.g., in users/navigation_toolbar.rst, we refer to the
image icons with:
.. image:: ../../lib/matplotlib/mpl-data/images/subplots.png
In the users subdirectory, if I want to refer to a file in the mpl-data
directory, I use the symlink directory. For example, from
customizing.rst:
.. literalinclude:: ../../lib/matplotlib/mpl-data/matplotlibrc
One exception to this is when referring to the examples dir. Relative
paths are extremely confusing in the sphinx plot extensions, so
without getting into the dirty details, it is easier to simply include
a symlink to the files at the top doc level directory. This way, API
documents like matplotlib.pyplot.plot() can refer to the
examples in a known location.
In the top level doc directory we have symlinks pointing to
the mpl examples:
home:~/mpl/doc> ls -l mpl_*
mpl_examples -> ../examples
So we can include plots from the examples dir using the symlink:
.. plot:: mpl_examples/pylab_examples/simple_plot.py
We used to use a symlink for mpl-data too, but the distro
becomes very large on platforms that do not support links (e.g., the font
files are duplicated and large)
To maximize internal consistency in section labeling and references, use hyphen separated, descriptive labels for section references, e.g.,:
.. _howto-webapp:
and refer to it using the standard reference syntax:
See :ref:`howto-webapp`
Keep in mind that we may want to reorganize the contents later, so
let’s avoid top level names in references like user or devel
or faq unless necessary, because for example the FAQ “what is a
backend?” could later become part of the users guide, so the label:
.. _what-is-a-backend
is better than:
.. _faq-backend
In addition, since underscores are widely used by Sphinx itself, let’s prefer hyphens to separate words.
For everything but top level chapters, please use Upper lower for
section titles, e.g., Possible hangups rather than Possible
Hangups
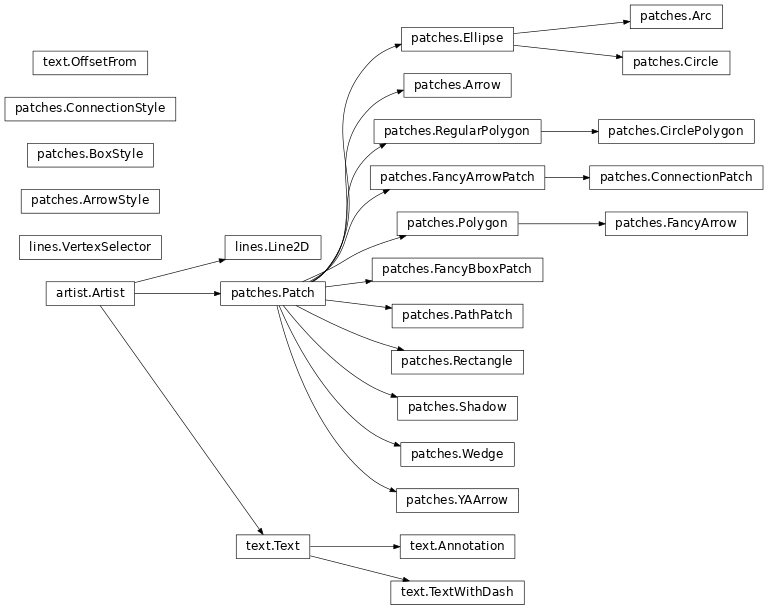
Class inheritance diagrams can be generated with the
inheritance-diagram directive. To use it, you provide the
directive with a number of class or module names (separated by
whitespace). If a module name is provided, all classes in that module
will be used. All of the ancestors of these classes will be included
in the inheritance diagram.
A single option is available: parts controls how many of parts in
the path to the class are shown. For example, if parts == 1, the
class matplotlib.patches.Patch is shown as Patch. If parts
== 2, it is shown as patches.Patch. If parts == 0, the full
path is shown.
Example:
.. inheritance-diagram:: matplotlib.patches matplotlib.lines matplotlib.text
   :parts: 2
There is an emacs mode rst.el which
automates many important ReST tasks like building and updating
table-of-contents, and promoting or demoting section headings. Here
is the basic .emacs configuration:
(require 'rst)
(setq auto-mode-alist
      (append '(("\\.txt$" . rst-mode)
                ("\\.rst$" . rst-mode)
                ("\\.rest$" . rst-mode)) auto-mode-alist))
Some helpful functions:
C-c TAB - rst-toc-insert

  Insert table of contents at point

C-c C-u - rst-toc-update

    Update the table of contents at point

C-c C-l rst-shift-region-left

    Shift region to the left

C-c C-r rst-shift-region-right

    Shift region to the right
